Technical Analysis Model
The following article describes TS_DayTrader pattern-based analysis model,
used in Frankenstein EA.
The model is implemented as iFrankenstein.ex5 indicator.
We will describe the model as well as the particular implementation
and most important associated parameters.
This presentation is meant to provide with
a deep understanding of the trading system and
the base theoretical model.
Framework Overview
The system allows for detection of a range of different patterns.
Pattern models can be complex and consist of multiple elements, the basic elements include:
- Key Level
- Test Level
- Сandle-pattern
- Divergence
All four work together to detect a very specific market response:
a reaction to the price breaking out of the horizontal channel, returning to it, then reversing at the specific
level(Test Level) and following again the bigger trend movement.
- Key Levels identify horizontal channels, the price breaking out of them,
bouncing within the channel.
- Test Levels identify price levels at which the price movement is supposed to reverse. ("reversal" definition)
- 10 candle-based patterns identify specific volatility patterns
that may signal about a coming reversal. These are trigger-signals.
- For divergences detection, Relative Strength Index type of indicator is used on different timeframes.
The goal of the system is to trade either the price bouncing between the boundaries of a channel or
the price breaking out of a channel.
A complex pattern model can include different patterns and their combinations, for ex.:
- Pattern Model, without KeyLevels
- KeyLevels + Pattern Model
- KeyLevels + Pattern Model + Test Levels
- KeyLevels + Pattern Model + Test Levels + Divergences + Technical Pocket
- Pattern Model + Divergences + Technical Pocket
- e.t.c...
Fractals
Most of the EA's technical analysis models use C_iFR - Fractals module - as main data input.
EA usually runs multiple C_iFR modules(multiple for each pattern),
each can be individually configured for a specified timeframe.
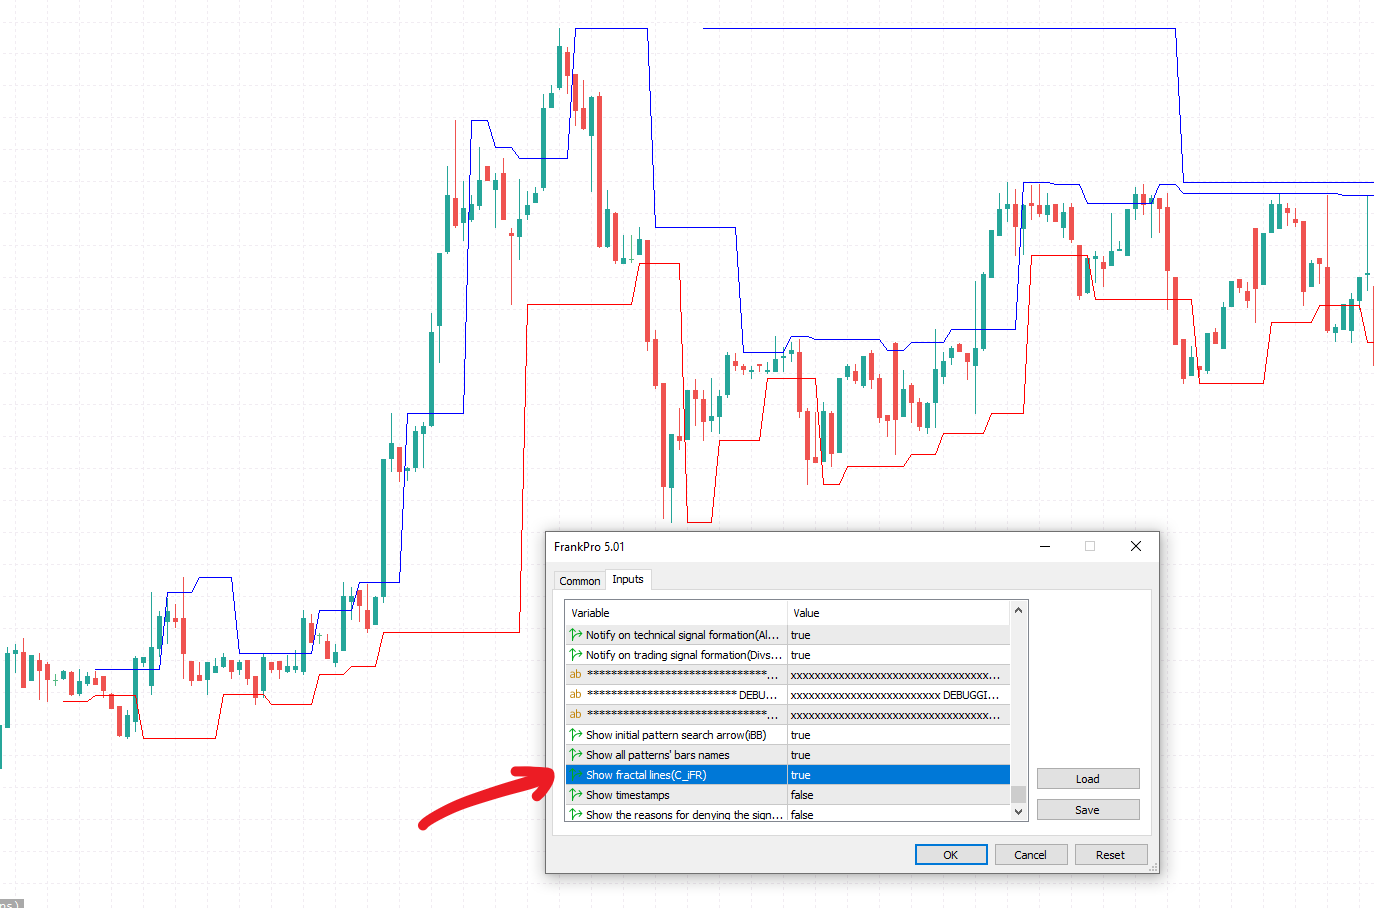
C_iFR is similar to 'Fractals.ex5' - a well-known MT5 indicator:
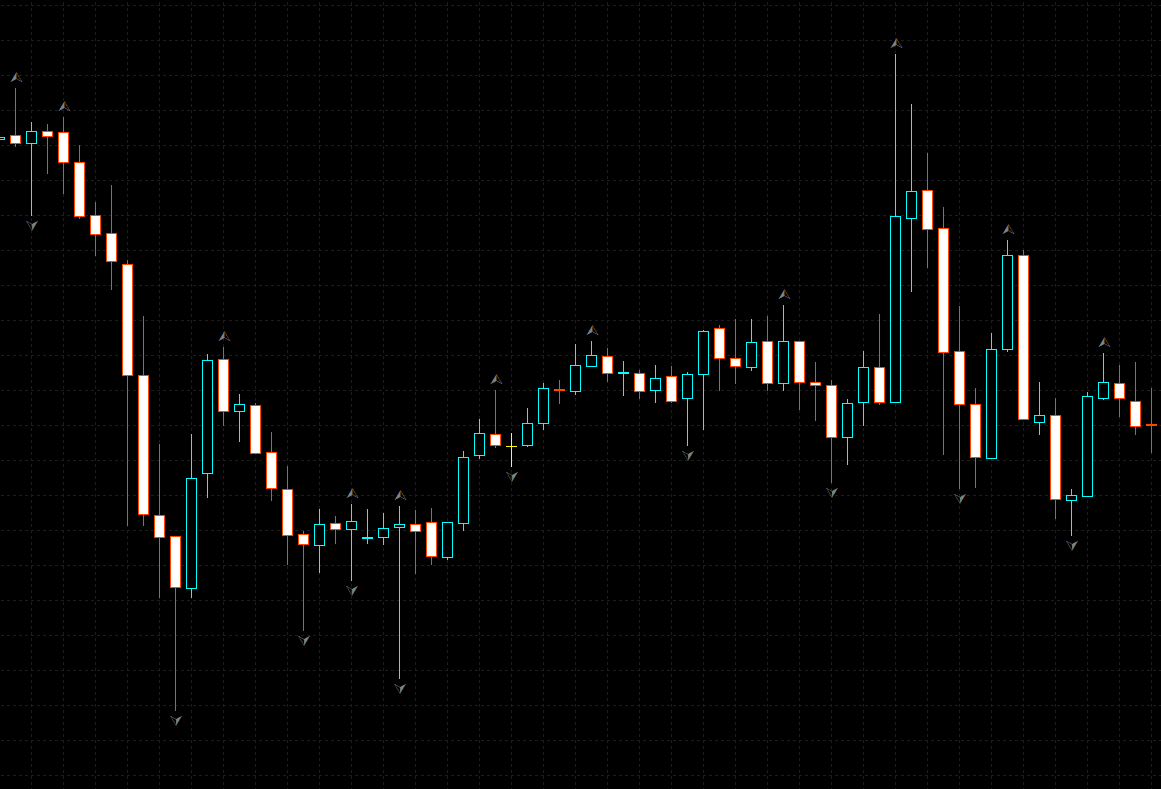
To see C_iFR data from the iFrankenstein Engine set 'Show fractal lines(C_iFR)' to true:
Each fractal data point marks a local price extremum - the last local price minimum or the last local price maximum.
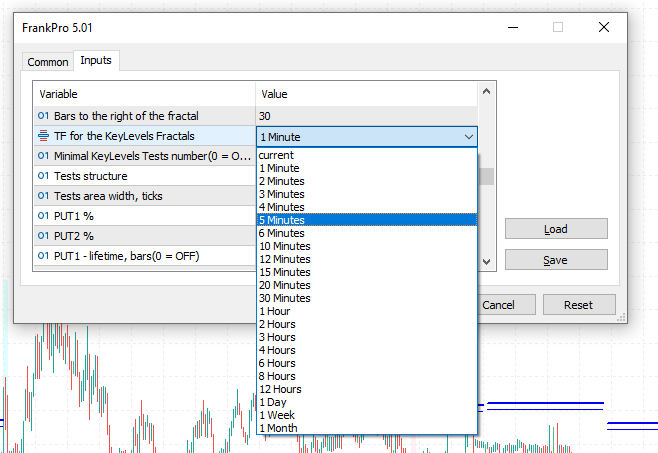
In contrast with 'Fractals.ex5', C_iFR can virtualize higher timeframes using the
data from the timeframe of the chart window.
The virtualized timeframe is set with the 'TF for the KeyLevels Fractals' parameter:
Fractal data is used to track the 'channel' of the price.
The price is likely to 'break out' of a channel on higher volumes. ("breakout" definition)
In the Market these channels are created by Orders accumulating
around the last local minimum or the last local maximum of the price.
iFrankenstein uses 'Key Levels' to track, display and trade these channels.
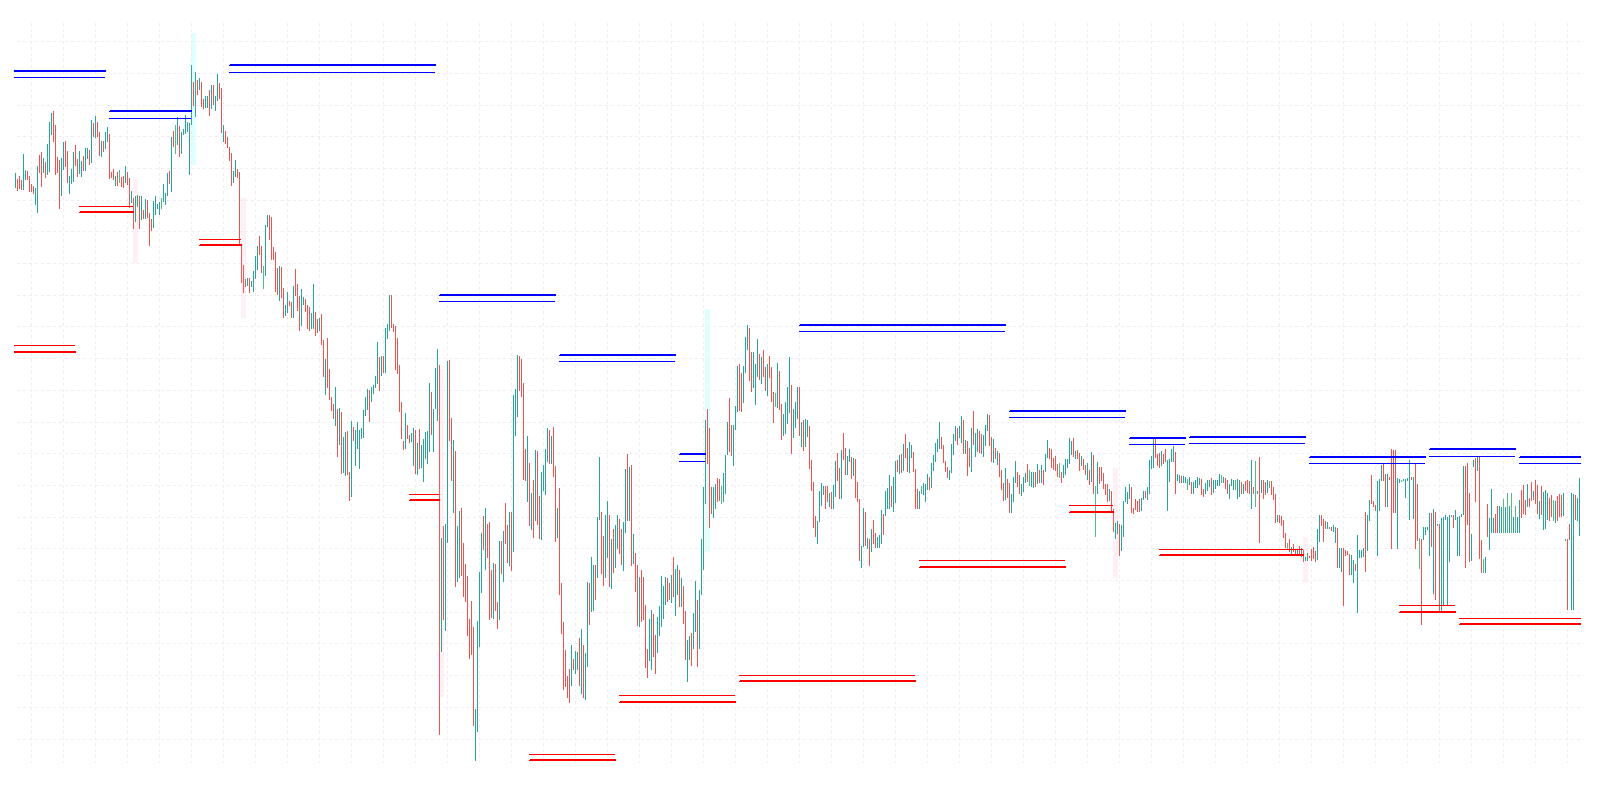
Key Levels
A Key Level is, basically, a horizontal line on a chart drawn from the last known price maximum or minimum
(defined by the last known fractal from the C_iFR).
2 Key Levels form a horizontal channel:
Price often 'bounces' inside such horizontal channel until it 'breaks out' of it.
A lot of trading strategies are based on this understanding of the market mechanics.
This is the most basic yet most important aspect of TA - understanding
the channels and observing how the price action reacts to their formation.
iFrankenstein model defines 2 Key Levels: KLS1 and KLR1.
KLS1 is also known as the 'support' and KLR1 as 'resistance'.
Sometimes reffered to as 'bearish' and 'bullish'.
They are mirror copies of each other.
Both can be used to create signals for BUY and for SELL trades.
A trader acts based on the premise that the price will either "touch" the level, jump from it and reverse,
or puncture it and continue the movement in the same direction as part of a bigger trend
or as a result of high volatility.
Tracking the way the Market reacts to these levels
is the core principle.
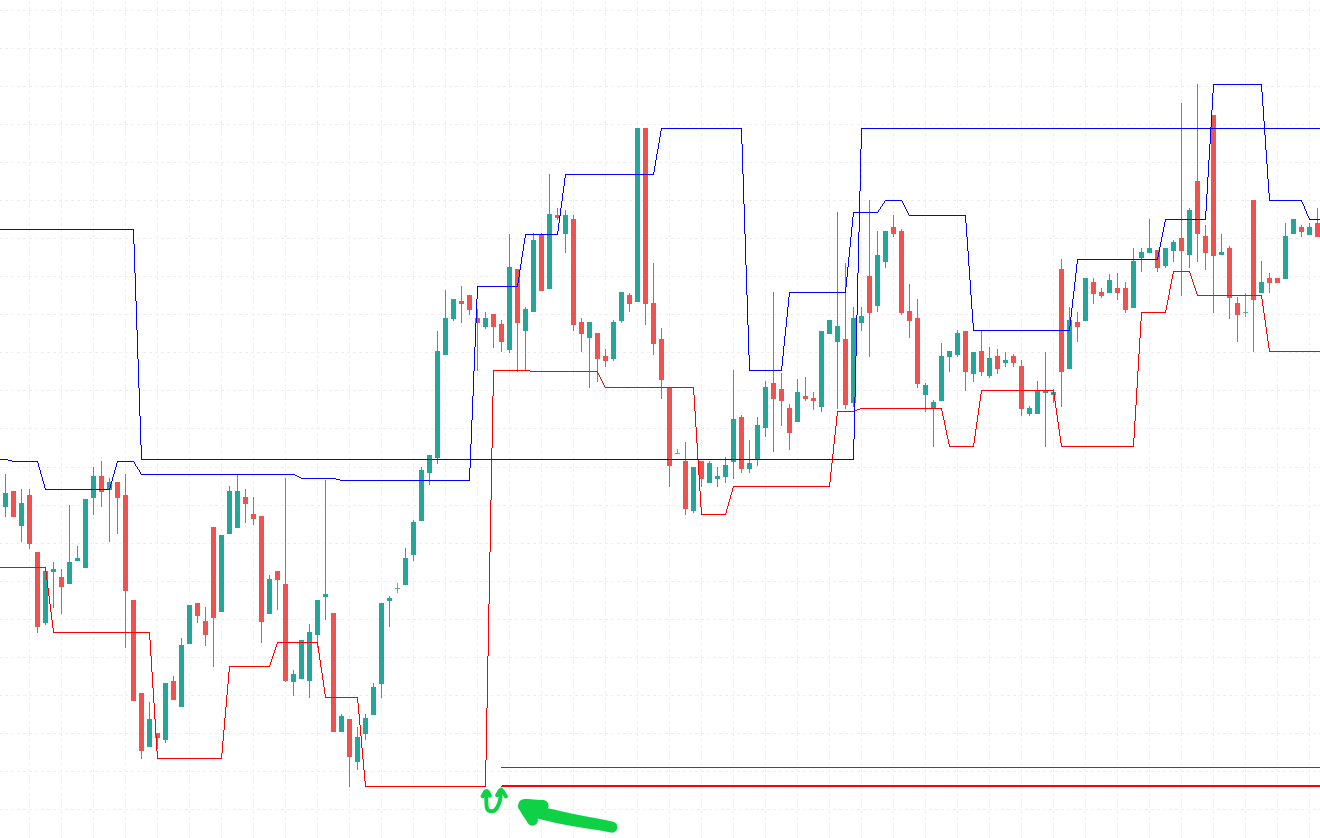
Key Support Level(KLS1)
KLS1(a.k.a. KUP1), first and foremost, is associated with the accumulation of BUY orders.
By default, it is drawn as a red horizontal line:
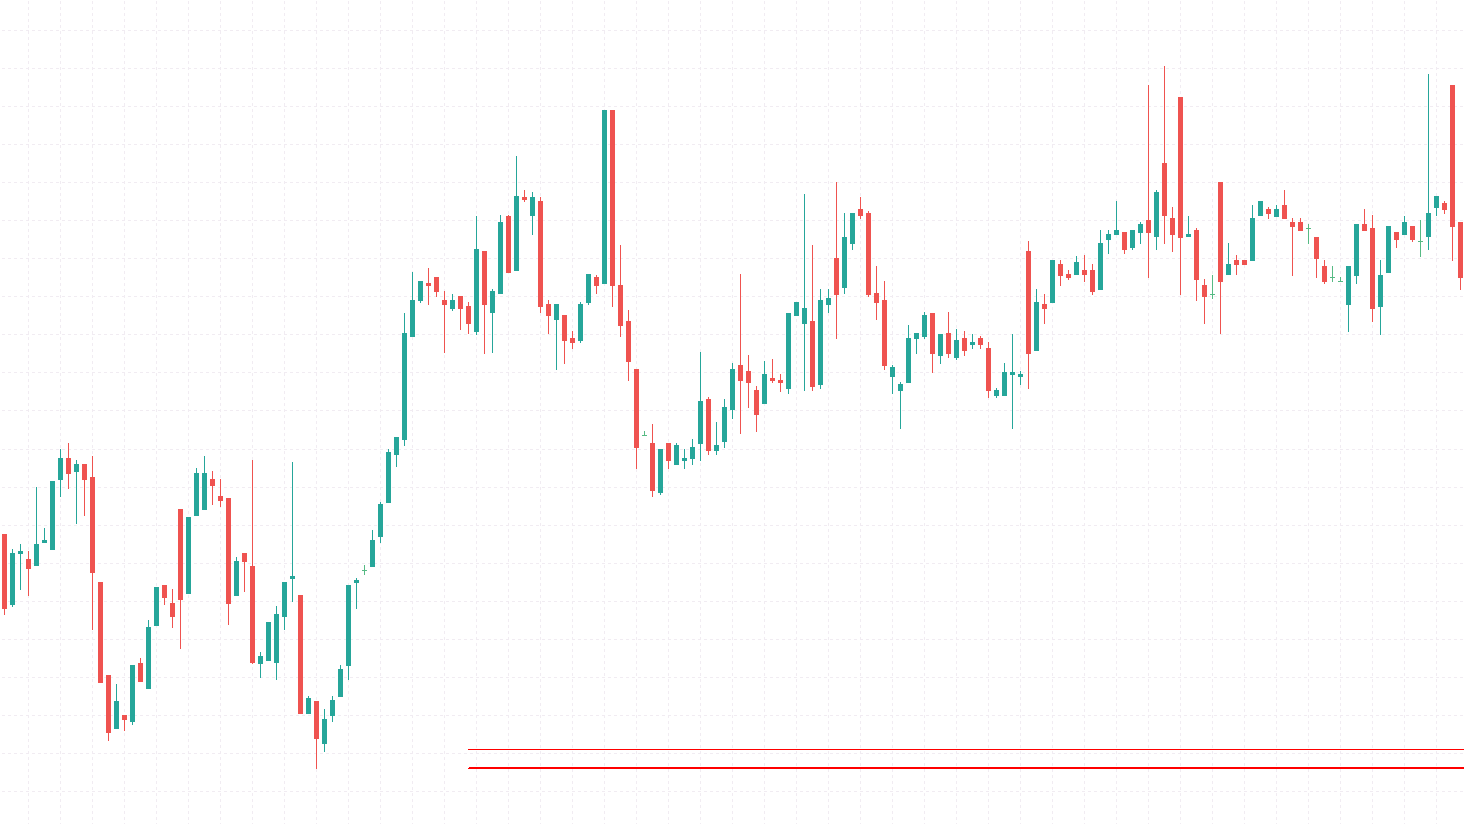
KLS2 is the thinner line.
You can turn on diplaying of fractal data for C_iFR('Show fractal lines(C_iFR)' parameter) to see
the sprecific fractal point(last price maximum or minimum) that the Key Level is based on:
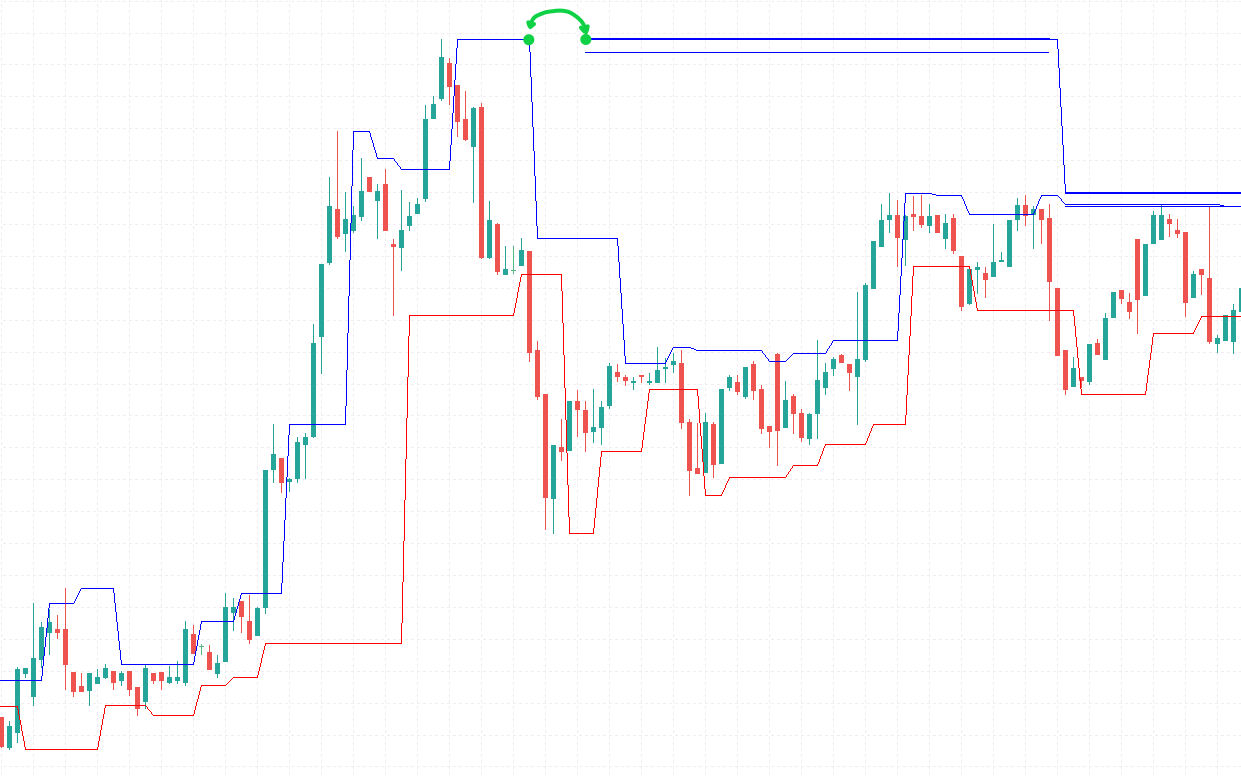
Key Resistance Level(KLR1)
Often, a lot of 'SELL' orders are accumulated around the KLR1(a.k.a. KUS1) level.
This main resistance level is drawn as a blue horizontal line:
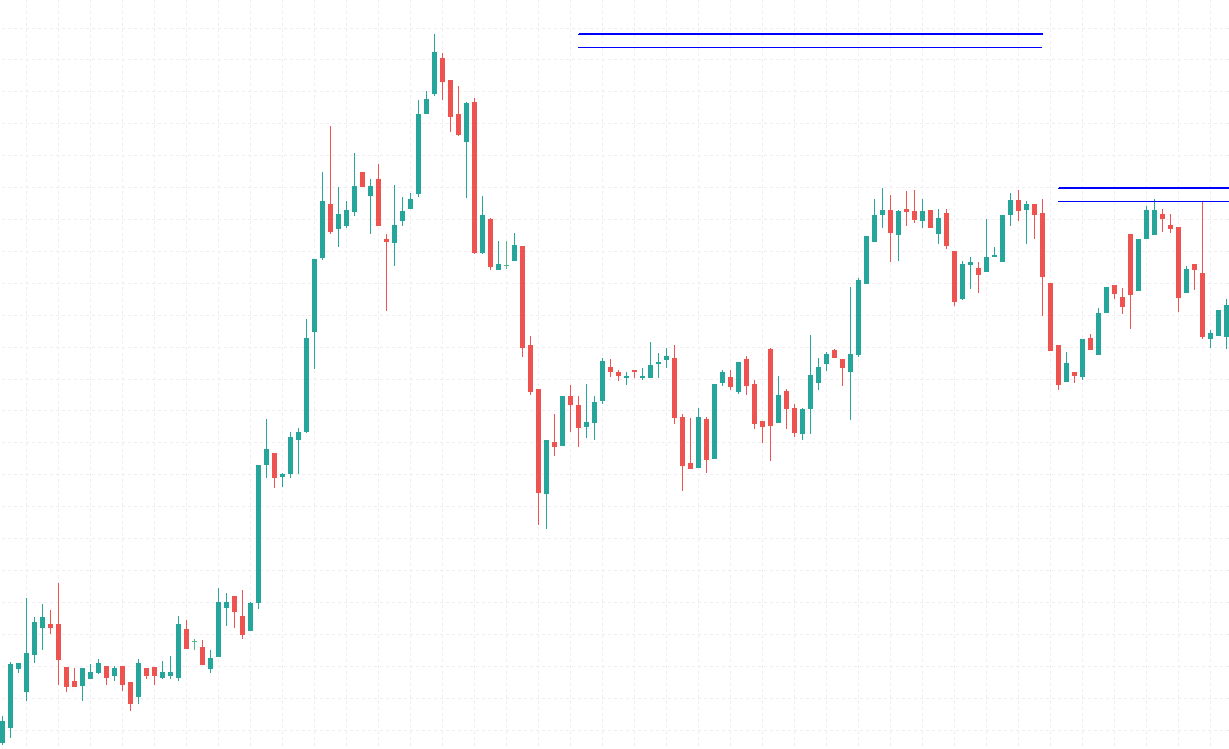
KLR2 is the thinner line.
The same way as with the KLS1, you can see for KLR1
the fractal point(last price maximum or minimum) that the Key Level is based on.
Set 'Show fractal lines(C_iFR)' to true to see the fractal data:
Key Level Tests
"Test of a Key Level" - is a failed attempt of the price to puncture a Key Level.
Depending on the input parameters, a Key Level Test(KLT)
is defined either as any single candle bar entering KLS1-KLS2 or KLR1-KLR2 region
or as series of bullish and then bearish(and vice versa) bars entering
and then exiting the above mentioned regions.
The next chart has 9 KLTs:
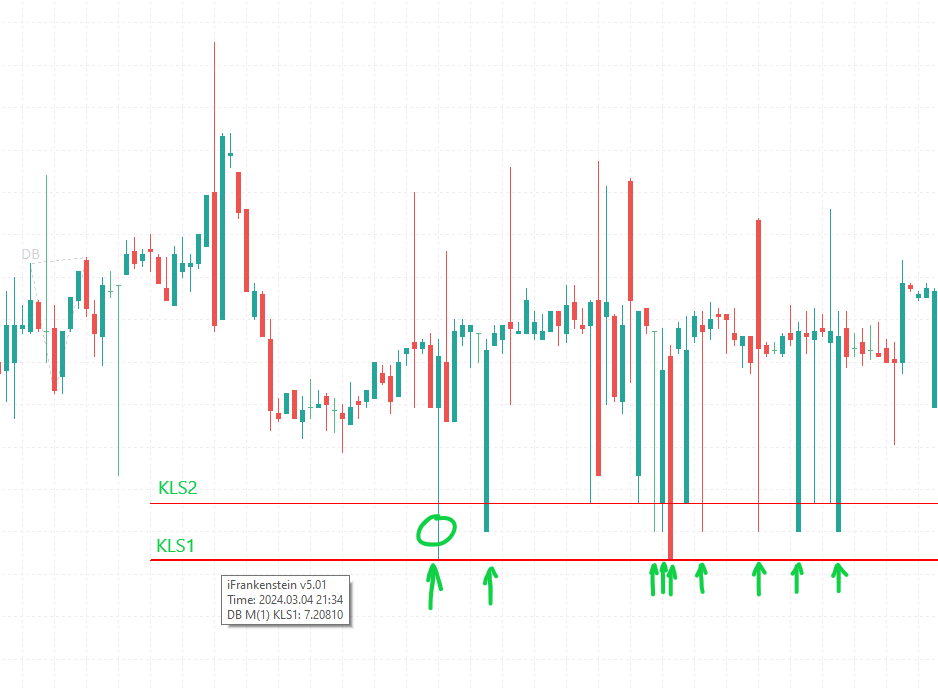
Parameter 'Tests area width, ticks' specifies the width of the KeyLevels region
sensitive to a 'KeyLevel Test'(KLS1-KLS2 or KLR1-KLR2 region).
Parameter 'Minimal KeyLevels Tests number(0 = OFF)' sets the minimal number of Key Level Tests required to approve a pattern for trading.
If this condition is not met - the pattern will be ignored by the program.
'Tests structure' - the miminal opposite bars number. The number of bars moving in the opposite direction(defined by open-close prices)
required for a Test to be confirmed. Also, the opposite bars must be in series, next to each other or separated by dodgees - '+' like patterns with open=close prices.
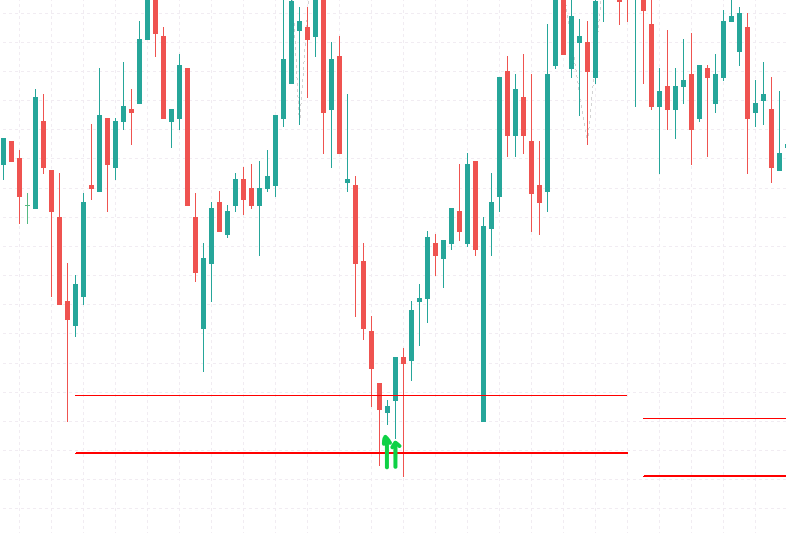
In the following example there's 1 Key Level Test with Structure=2, meaning that there's
two consecutive bullish bars following the first bearish bar that entered the KLS1-2 region:
Test Levels
When a Key Level is 'punctured', for 1-8 candle-based pattern models,
'Test Levels' appear.
For the BSB-MSB(9-10) pattern models, 'Profit Zones' appear.
Test Levels do not appear in case if Key Level Tests requirements are not met.
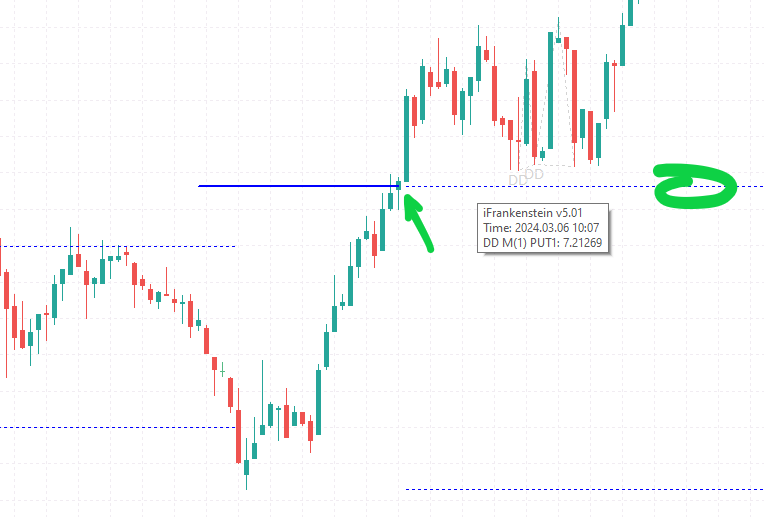
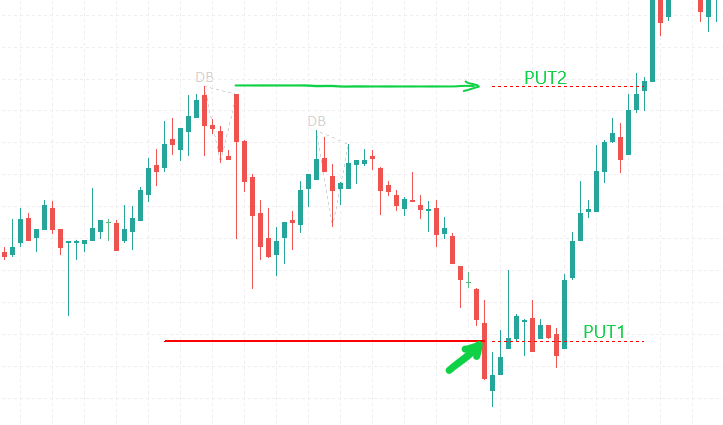
PUT1
PUT1 - is a 'Test Level'.
It symbolizes the KeyLevel(defined by previous price extremum)
that was previously punctured by the price movement:
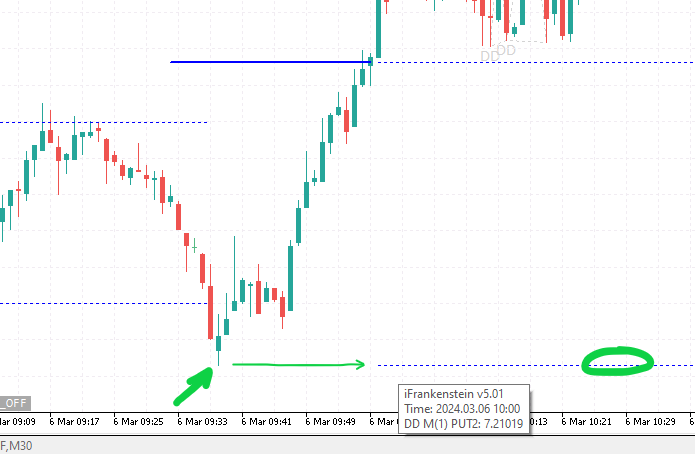
PUT2
PUT2 - is also a 'Test Level', similar to PUT1,
but it represents the opposite previous extremum(the opposite border of the current channel):
For 'bearish' market the same logic is applied, just reverse the colors blue to red
and reverse the positions:
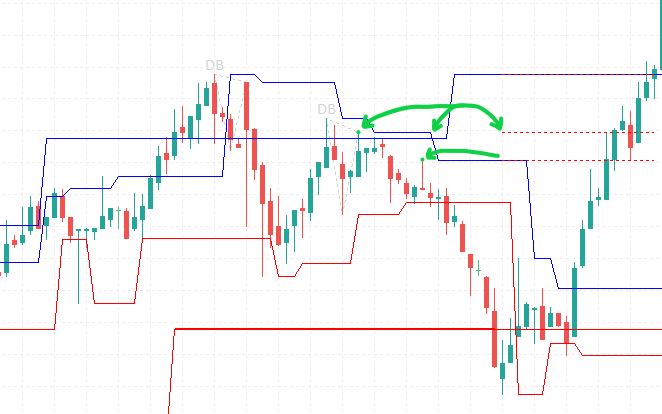
Fractal Test Levels
In addition to simple Test Levels, based on the channel borders,
iFrankenstein model features Fractal Test Levels.
These are built based on previous fractals from the associated C_iFR module.
Fractals are detected prior to KeyLevel Puncture and PUT1,2 formation.
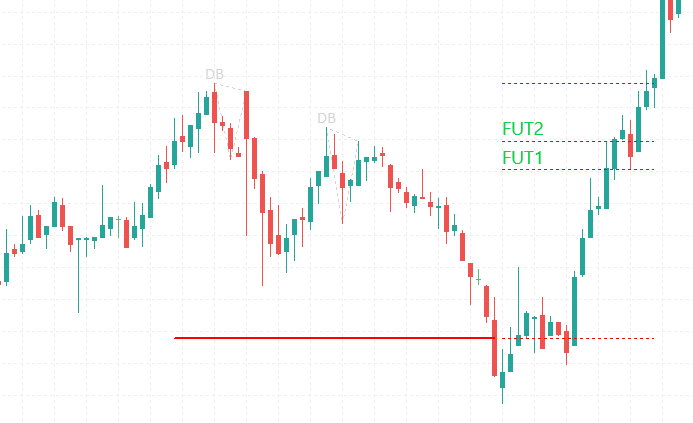
FUT1,FUT2
'FUT1' symbolizes the very last(the newest) fractal from the specified timeframe,
'FUT2' is the older fractal, the penultimate one.
 \
\
With the data from C_iFR you can see the exact price peaks that formed
the fractals:
Configuration
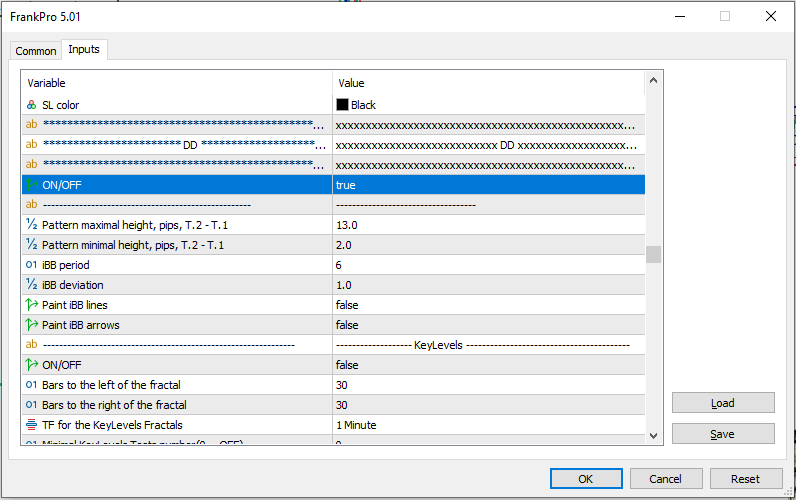
In iFrankenstein, for each of the 10 patterns there's
a separate block of input parameters associated with Key Levels
under the 'KeyLevels' category:
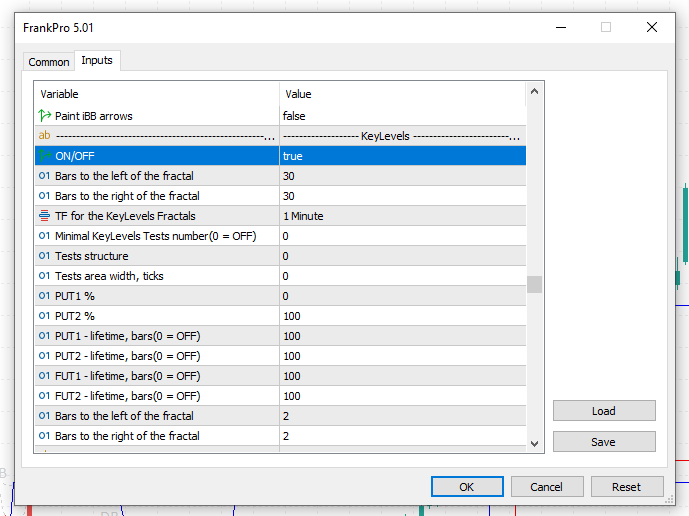
KeyLevels and TestLevels parameters:
- 'ON/OFF' turns on/off the KeyLevels module(and Test Levels as well).
- 'Bars to the left of the fractal' specifies the number of bars to the left of the fractal for the main C_iFR module.
It tunes the performance of the fractal parser.
- 'Bars to the right of the fractal' same as the above, but specifies the number of bars to the right of the fractal.
Generally speaking, the narrower the range specified by these two parameters, the more fractals are discovered
by the algorithm. But it increases the amount of 'noise'.
- 'TF for the KeyLevels Fractals' switches the timeframe. Can only be equal to the timeframe of the chart or be higher.
If the lower timeframe is used the parameter will be automatically incremented
and set to be the current timeframe of the chart window.
- 'Minimal KeyLevels Tests number(0 = OFF)' sets the minimal number of Key Level Tests required to detect(identify) a pattern.
- 'Tests structure' - the miminal opposite bars number. The number of bars in the opposite direction(defined by open-close prices)
required for a Test to be confirmed. Also, the opposite bars must be in series, next to each other or separated by dodgees- '+' like patterns with open=close prices.
- 'Tests area width, ticks' specifies the width of KeyLevels sensitive to 'KeyLevel Tests'.
- 'PUT1%' corrects the position of the PUT1 vertically, % relative to the distance between PUT1 and PUT2.
- 'PUT2%' corrects the position of the PUT2 vertically, % to the distance between PUT1 and PUT2.
- 'PUT1 - lifetime, bars(0 = OFF)' - the lifetime of PUT1, in number of bars of the timeframe specifed with 'TF for the KeyLevels Fractals' parameter.
- 'PUT2 - lifetime, bars(0 = OFF)' - the lifetime of PUT2.
- 'FUT1 - lifetime, bars(0 = OFF)' - the lifetime of FUT1.
- 'FUT2 - lifetime, bars(0 = OFF)' - the lifetime of FUT2.
- 'Bars to the left of the fractal' specifies the number of bars to the left of the fractal for the separate C_iFR module used for FUT1,2 detection.
- 'Bars to the right of the fractal' - same as the above, but specifies the number of bars to the right of the fractal.
10 Basic Patterns
There are 10 basic candle-based pattern models used to predict price movements.
DD,DB,SD,SB,RD,RB,SSD,SSB - indexed as 1-8 - 'triangle' models symbolizing specific volatility regions that form visible "dips and tops".
BSB,MSB - 9-10 - 'StartBar' type of patterns. This model consists of specific series of bars detected within a 'Profit Zone(Channel)'.
5 patterns are for 'SELL' trades and 5 patterns are for 'BUY' trades, they are mirror copies of each other.
BUY: DD,SD,RD,SSD,BSB
SELL: DB,SB,RB,SSB,MSB
Each pattern model and all associated with it modules can be activated or completely deactivated with 'ON\OFF' parameter:
These 10 patterns are used either without any additional models
or in conjunction with prior punctured KeyLevel and a triggered TestLevel(as part of a bigger complex model).
Each of these 10 patterns, when completed, sets up an Entry Point - the bar and price at which
the EA enters the market(opens a trade).
Patterns can be used on their own.
We recommend combine them together with KeyLevels and TestLevels - this is a more productive setup.
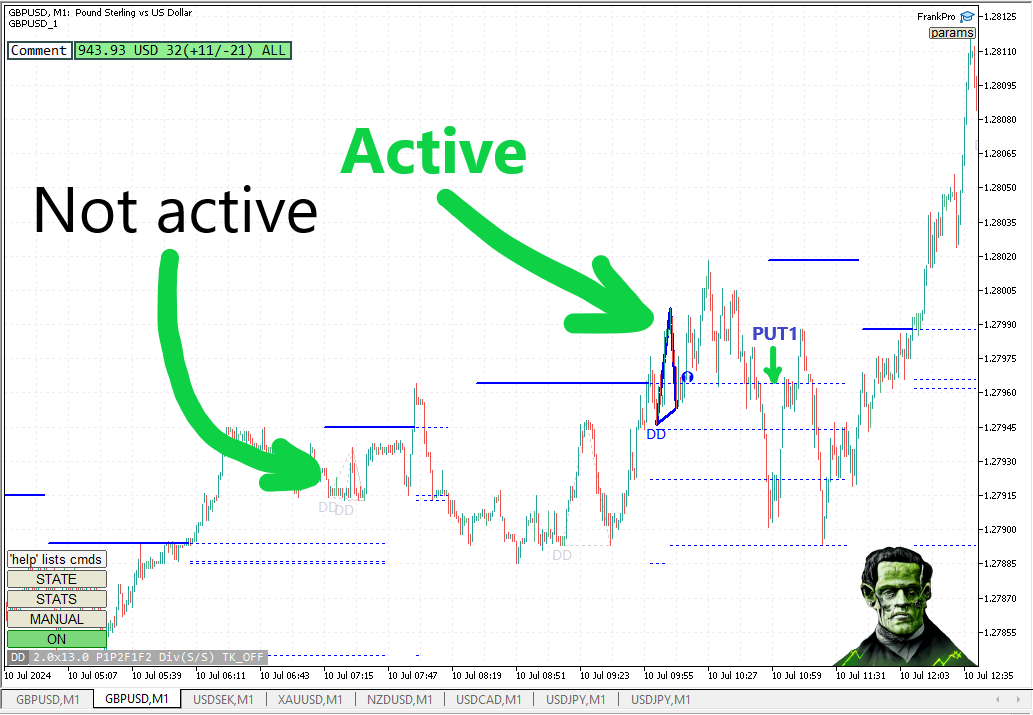
Complex pattern
When used in conjunction with KeyLevels and TestLevels, a pattern is approved for trading
and an Entry Point is created only if the 'left edge' of the 'triangle' is located at the specified TestLevel(simple or fractal one, PUT1,2 or FUT1,2).
(in case of 'triangle' patterns 1-8)
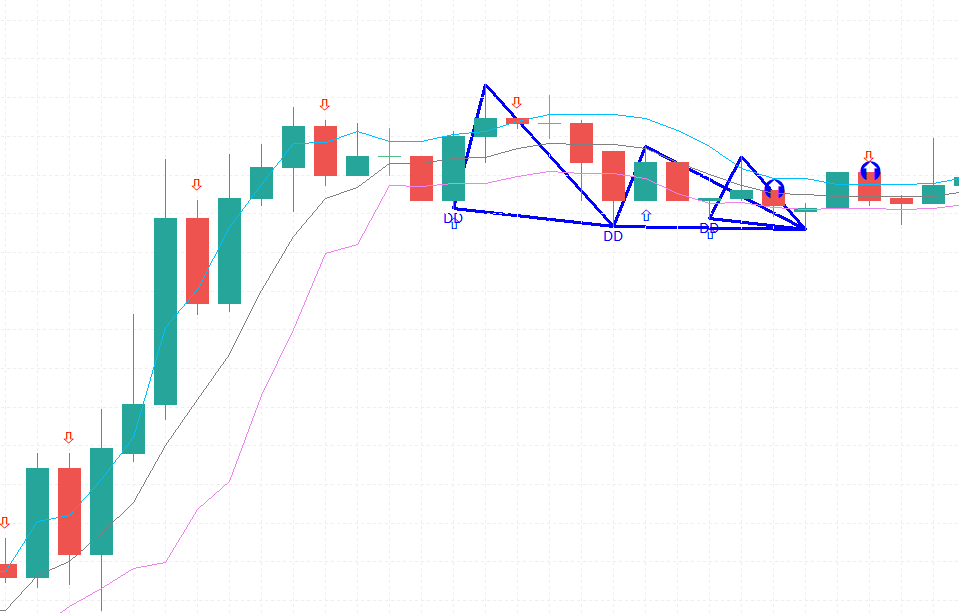
In the following example some DD patterns are not active(greyed out),
but one is active - it was 'punctured' through with PUT1 level:
Patterns 1-8:
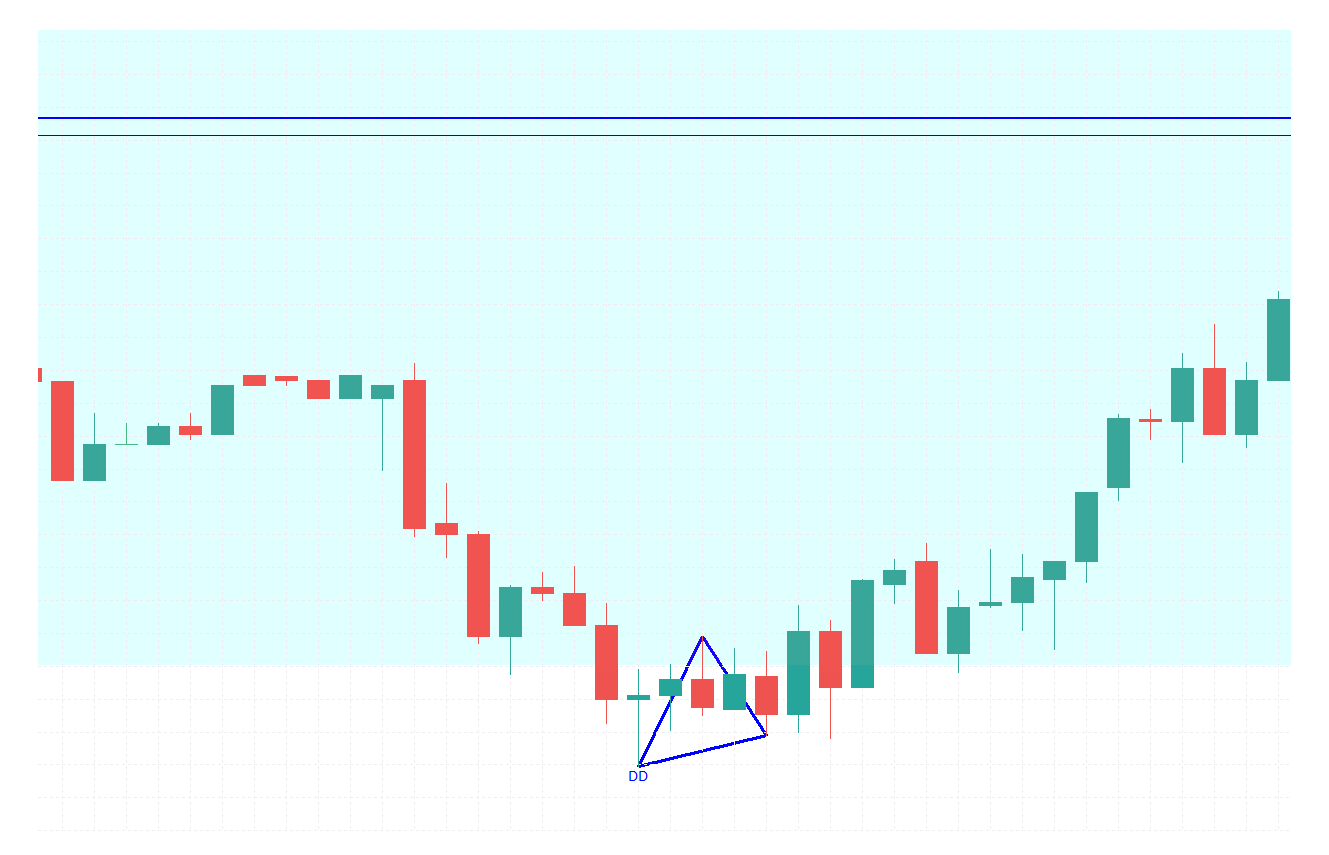
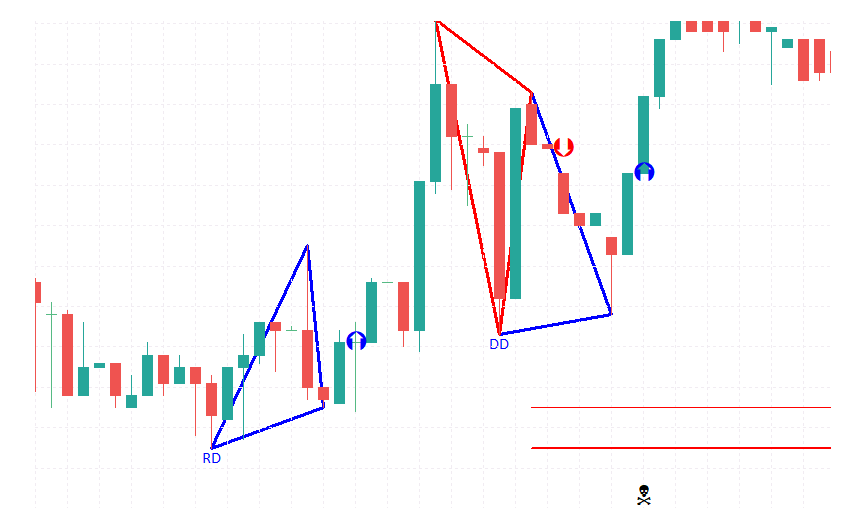
DD
DD is also known as "Double Bottom".
Often used as a simple BUY signal, but can be used as part of a more complex pattern.
On chart it is displayed as a symbolic blue triangle and a 'DD' label below it:
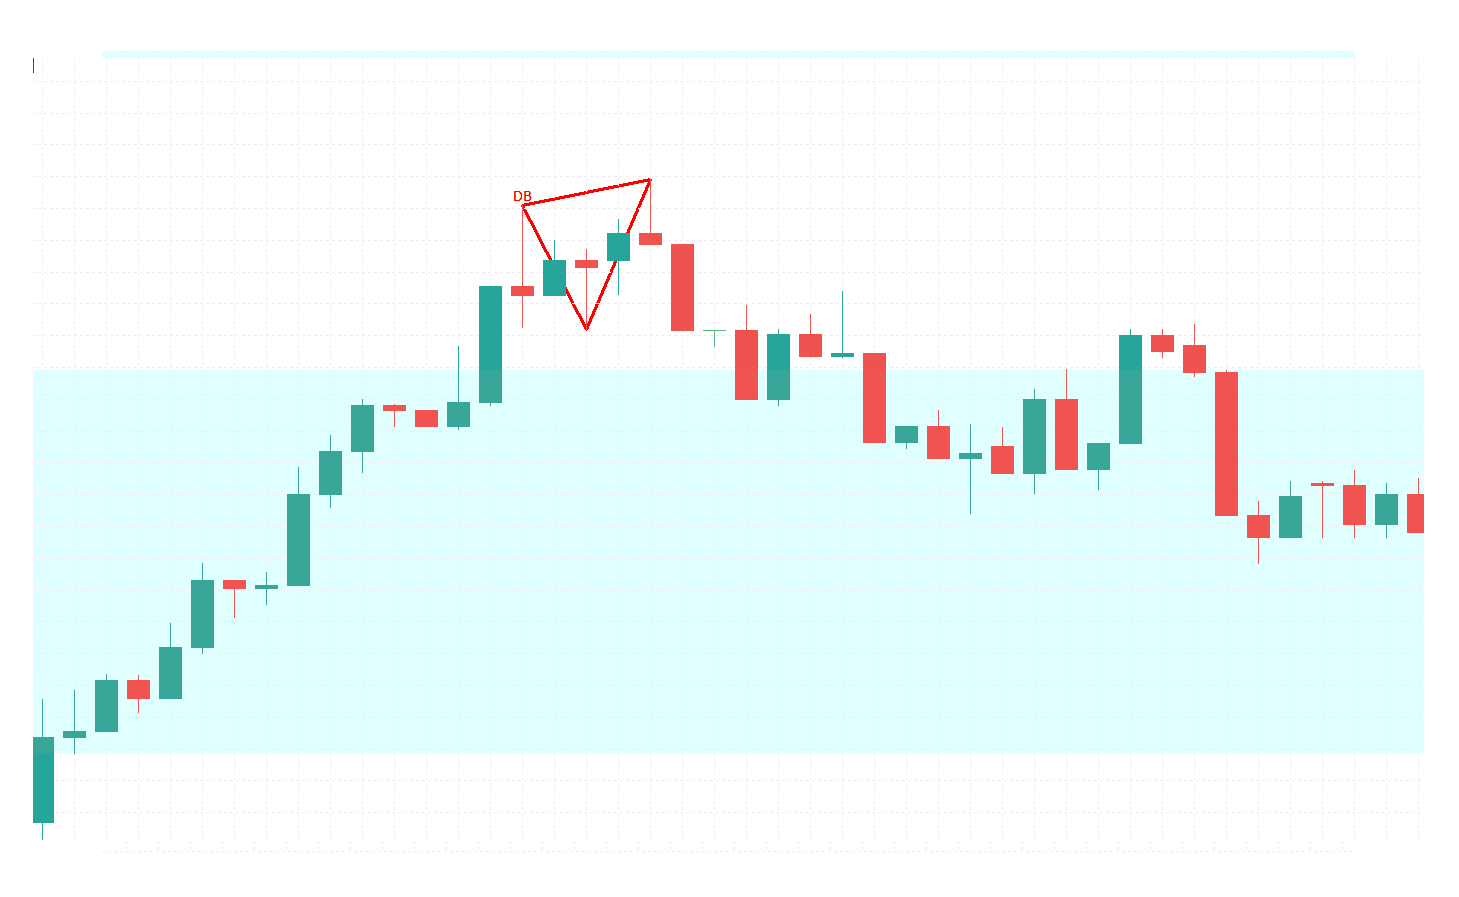
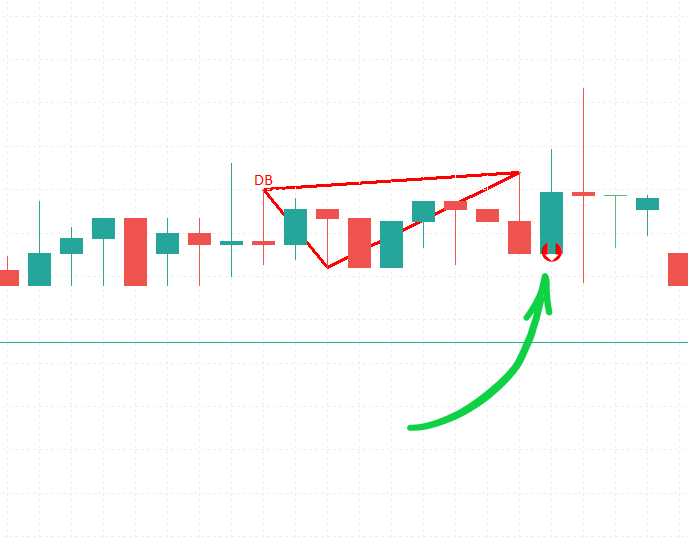
DB
DB is also known as "Double Top".
It is considered to be a SELL signal.
On chart it is displayed as a symbolic red triangle and a 'DB' label below it:
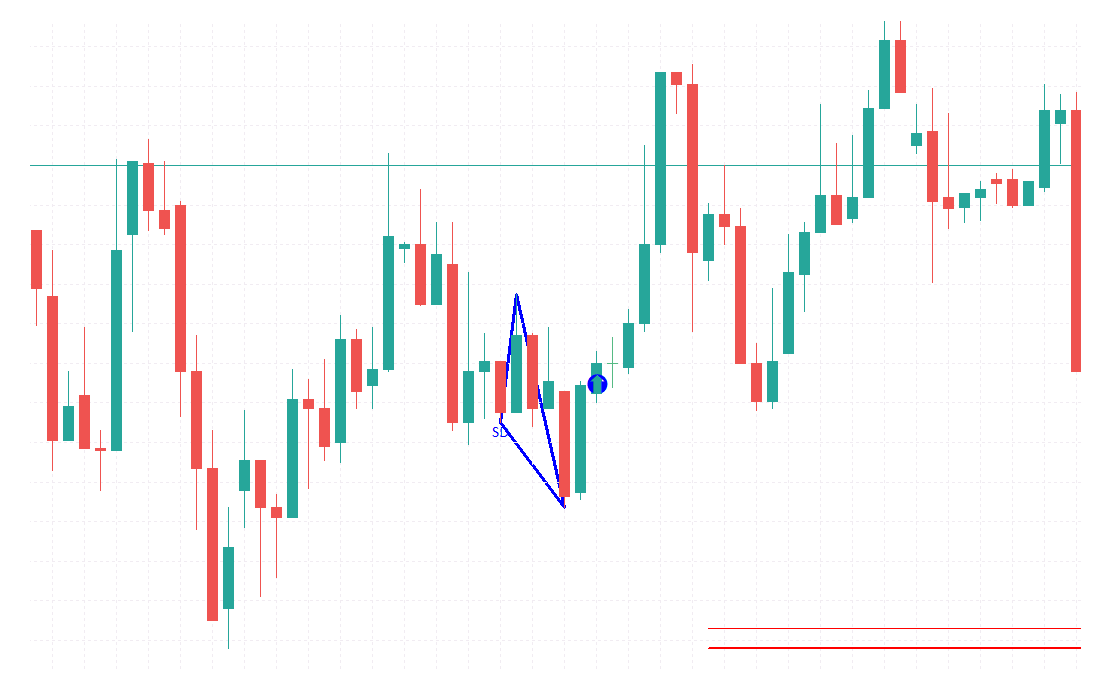
SD
SD is also known as "Weak Bottom".
It is a BUY signal.
Displayed as a symbolic blue triangle with 'SD' label below it:
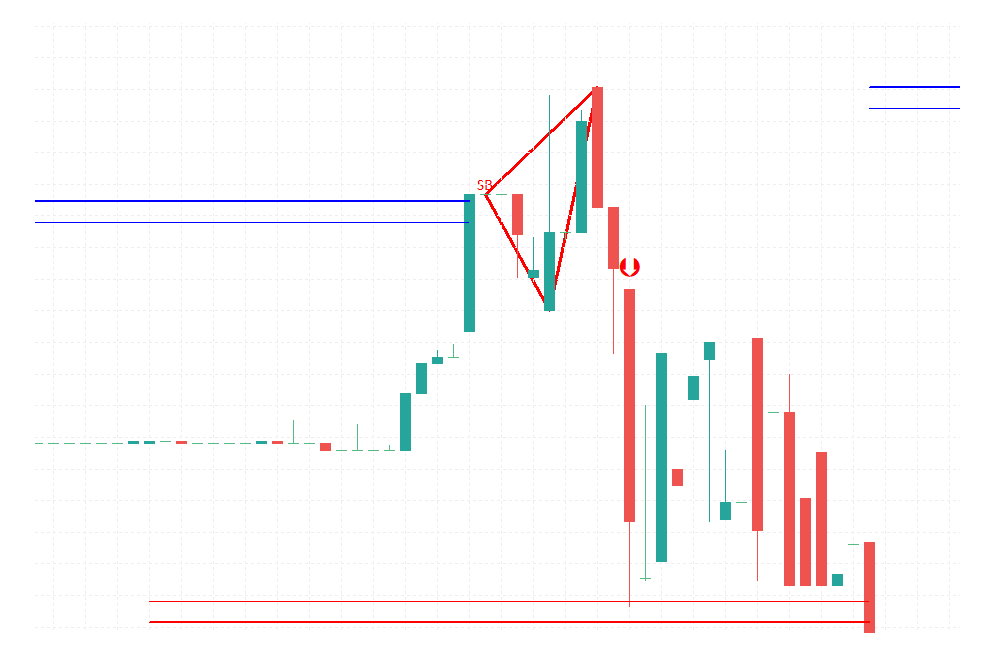
SB
SB is also known as "Weak Top".
It is a SELL signal.
Displayed as a symbolic red triangle with 'SB' label below it:
RD
RD is also known as "Reversal Bottom".
It is a BUY signal.
Displayed as a symbolic blue triangle with 'RD' label below it:
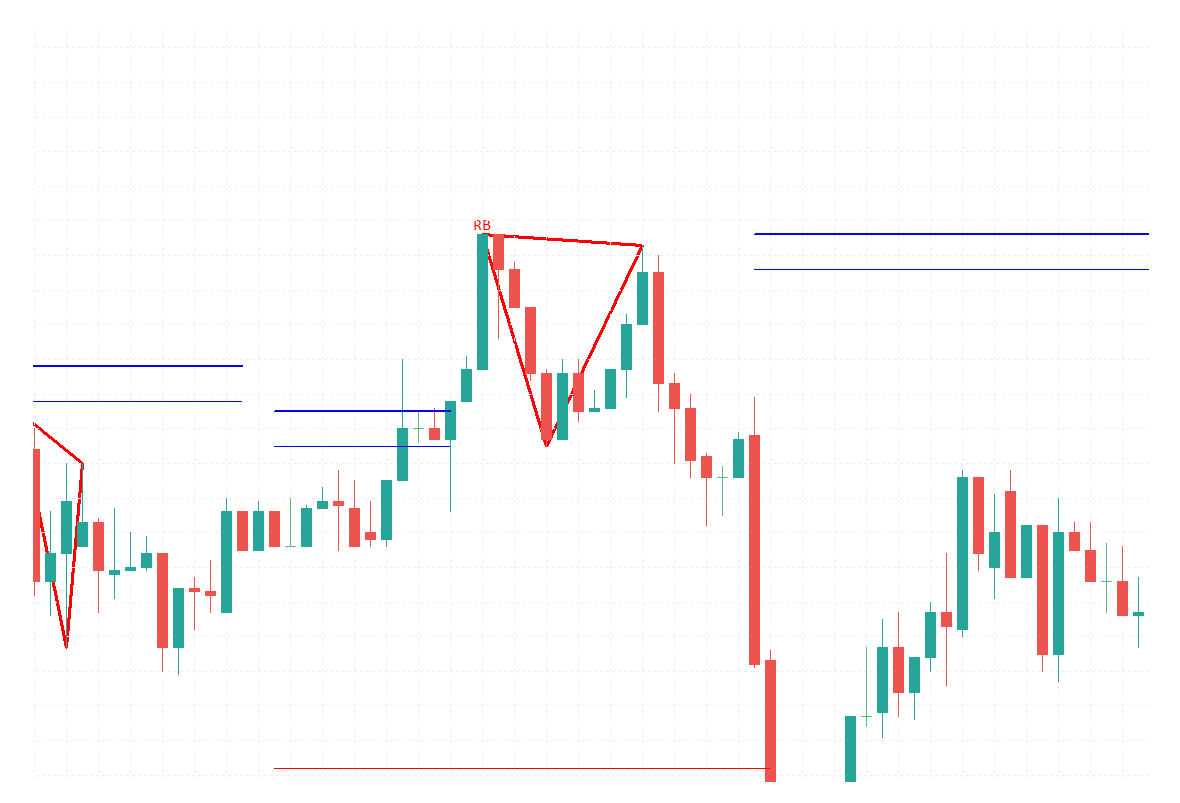
RB
RB is also known as "Reversal Top".
It is a SELL signal.
Displayed as a symbolic red triangle with 'RB' label below it:
RD,RB Correction Level
RD(and RB) has additional parameter - 'CL(Correction Level)':
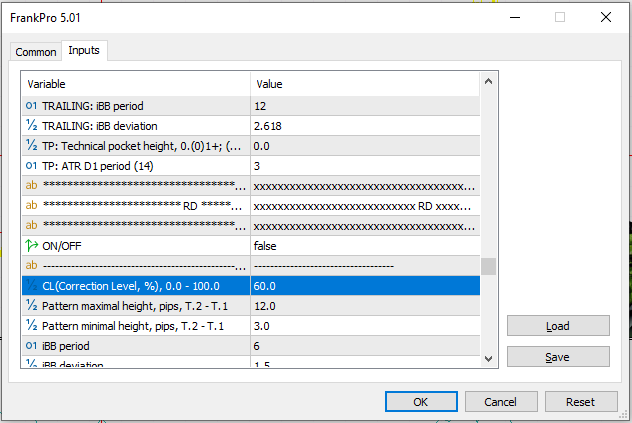
In the next example, line 1.2
represents Correction Level set to 90%:
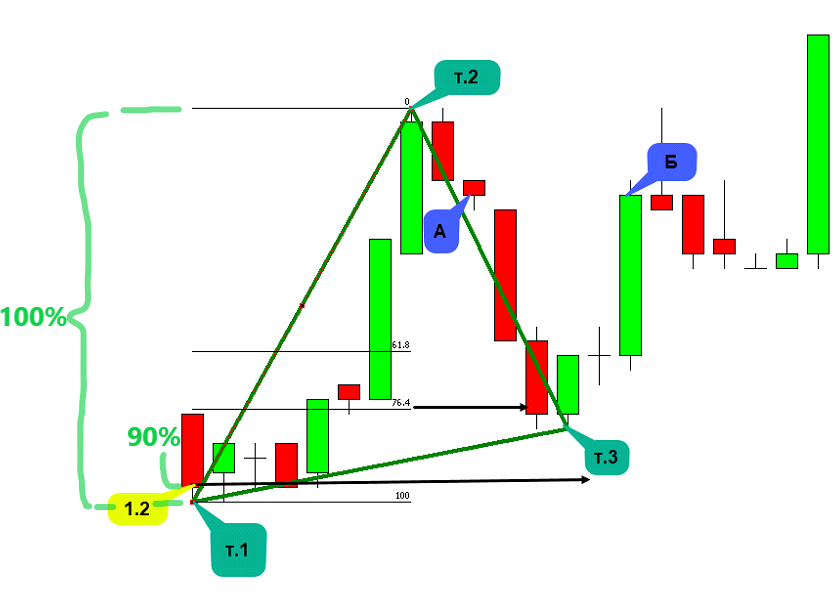
The T.1 - T.2 distance (height of the left edge of the "triangle") is 100%.
Correction Level module acts as a filter.
If T.3 Price, the bar low, is located below the price of the Correction Level - the
pattern model is considered complete and approved, in other case -
the pattern is not complete and not processed any further.
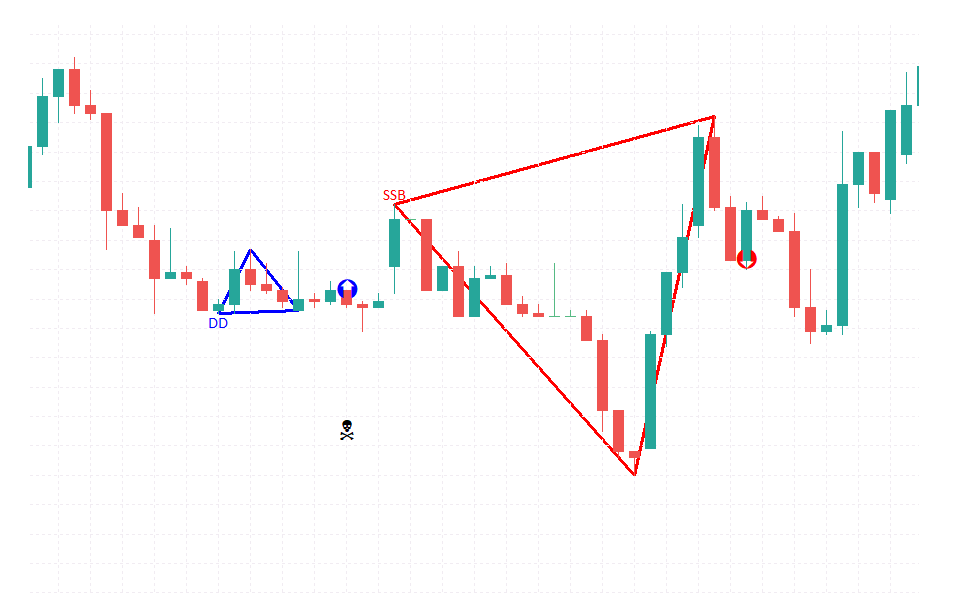
SSD
SSD is also known as "Complex Weak Bottom".
It is a BUY signal.
Displayed as a symbolic blue triangle with 'SSD' label below it:
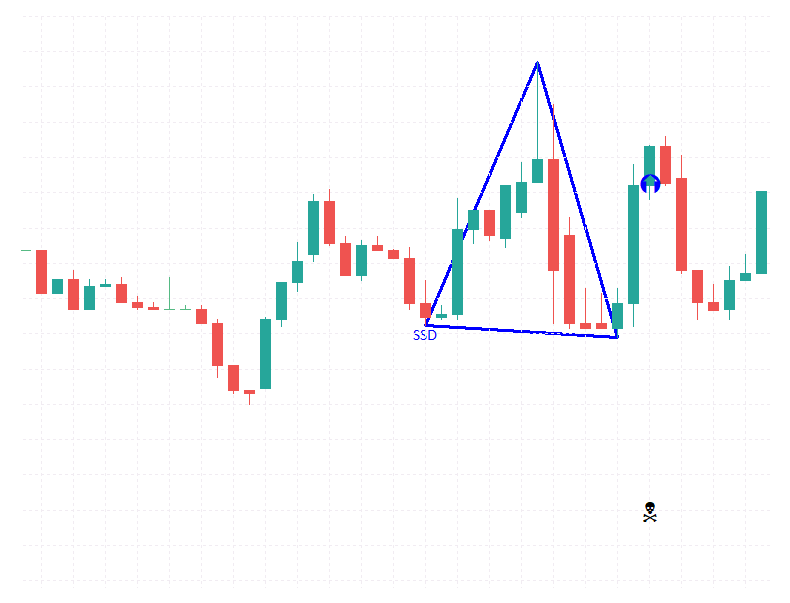
SSB
SSB is also known as "Complex Weak Top".
It is a SELL signal.
Displayed as a symbolic red triangle with 'SSB' label below it:
Pattern Height
All "triangle" patterns have 'Pattern maximal height' and 'Pattern minimal height' parameters, they act as a simple filter:
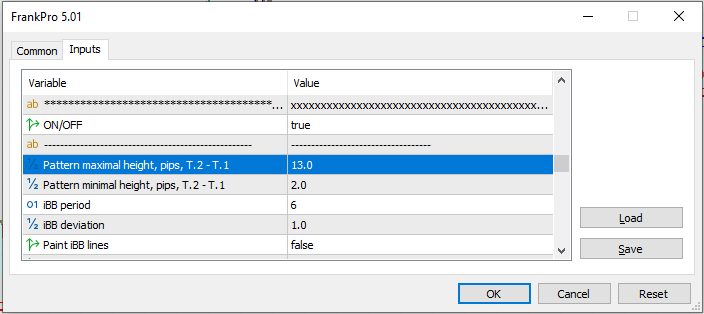
"Pattern Height" is the height of the left edge of the triangle:
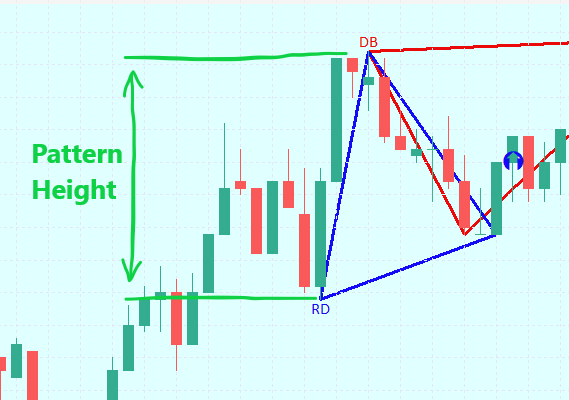
Patterns that are too big or too small are not displayed and not processed any further.
iBB
A custom Bollinger Bands - iBB - is in the 'recipe' for patterns 1-8 ('triangles'), it's part of their models.
Its dynamics is used to determine the beginning of the pattern.
For each pattern there's a separate iBB section:
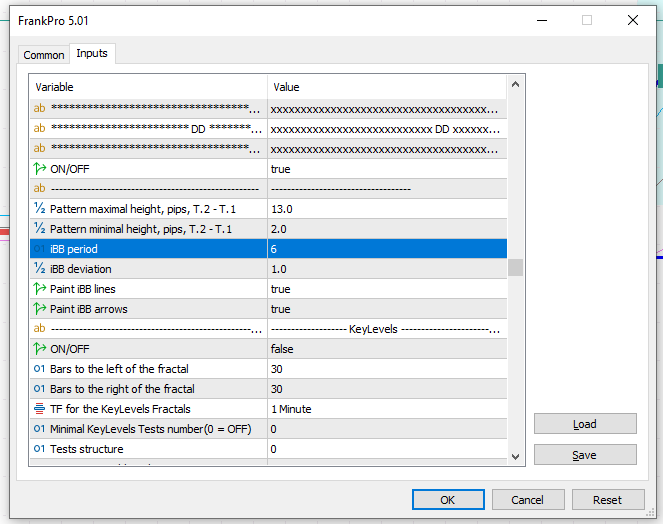
To calibrate(and to optimize) iBB use input parameters:
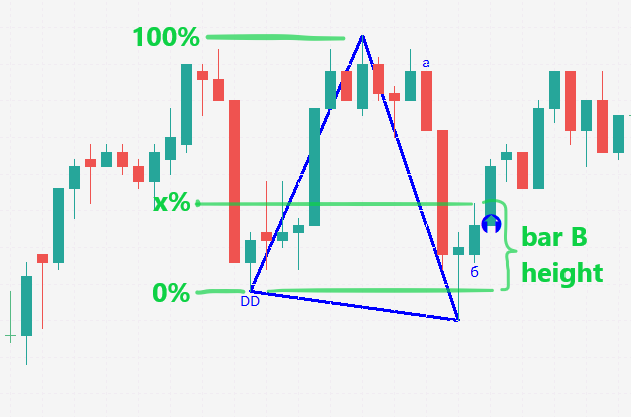
Bar B.
There's additional filter associated with the "bar B", it acts as a basic anti-slippage filter and position filter.
"bar B" is a name for the bar that forms a reversal movement.
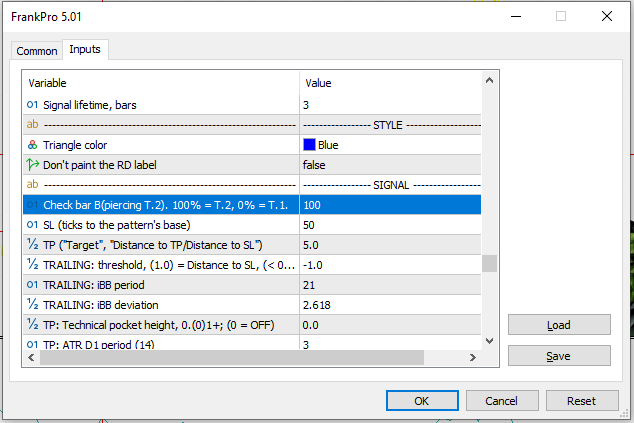
Basically, the height of the left edge of the triangle is considered 100%.
If bar B(the bar previous to the Entry Point) exceeds the price level specified
by 'Check bar B' parameter - trading is denied.
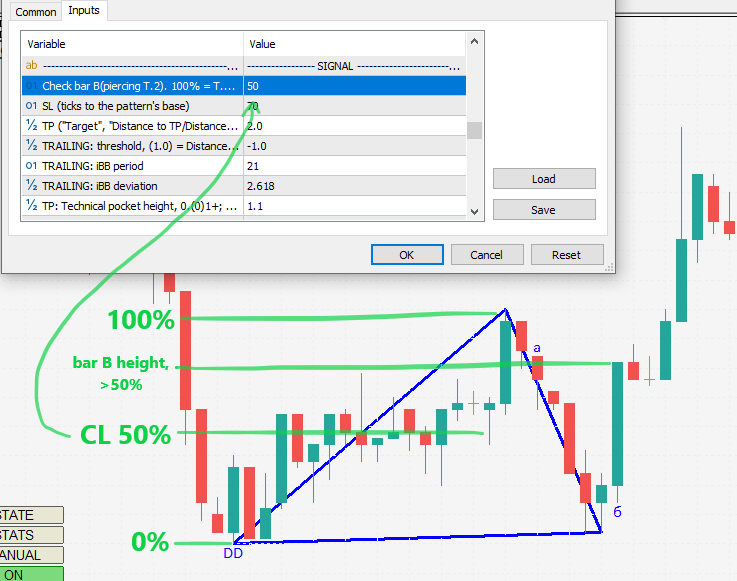
Example of a pattern that has "bar B" within allowed parameters:
In the next example, "bar B" is too high - the price has exceeded the 50%.
Trading is forbidden because of it:
Patterns 9-10:
BSB
BSB is also known as "Bullish Start Bar".
It is a BUY signal.
Displayed as a blue-ish rectangle:
MSB
MSB is also known as "Bearish Start Bar".
It is a SELL signal.
Displayed as a red-ish rectangle:
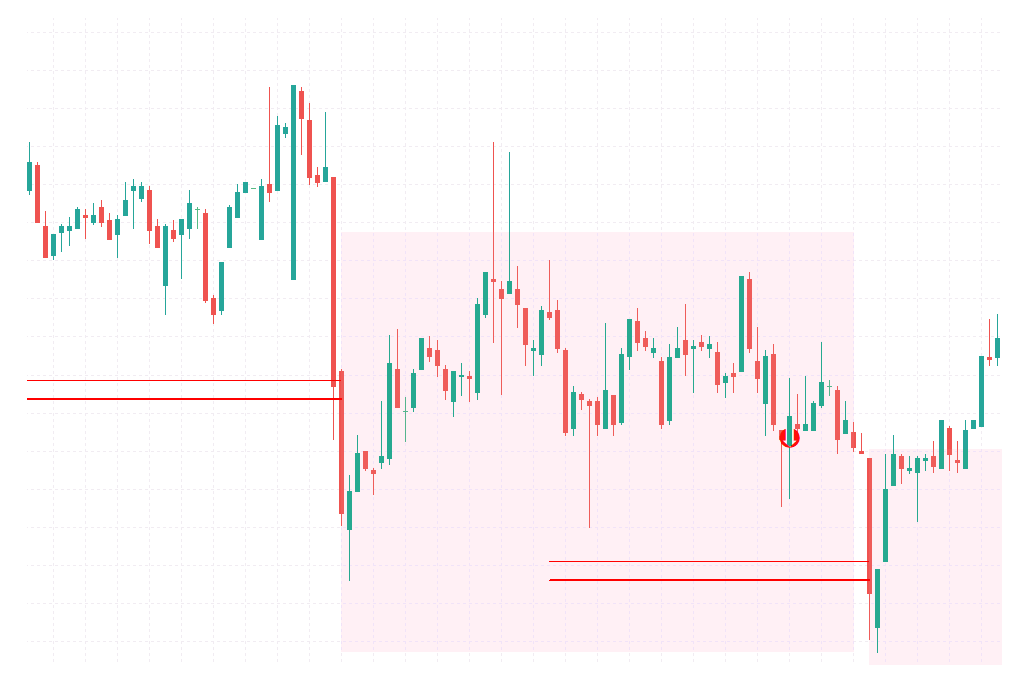
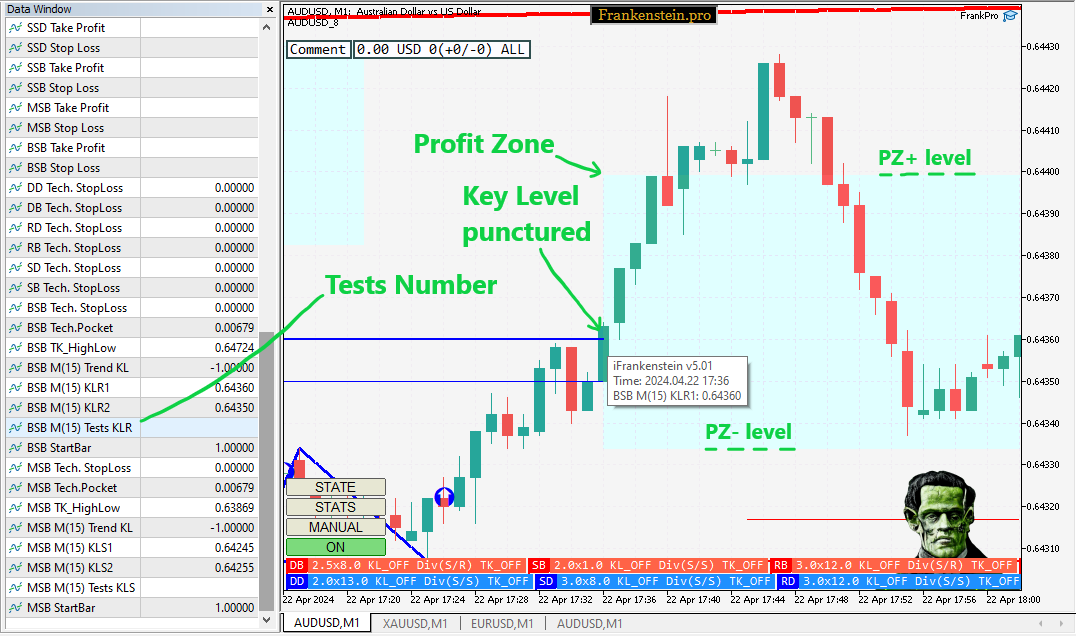
Profit Zone
Both patterns - MSB and BSB - start with a Key Level puncture.
Once a Key Level is punctured by price movement, and if the conditions for KeyLevels Tests are met,
a Profit Zone appears:
Profit Zone is configured with parameters under the "Profit Zone" category for BSB and MSB:
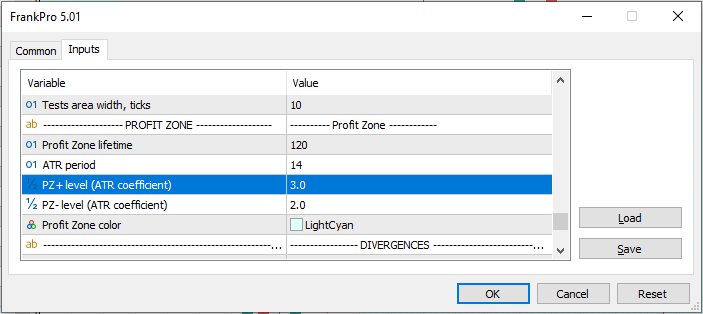
The LifeTime is set in number of bars.
ATR(Average True Range) indicator value at the moment of KL puncture
is used to determine Profit Zone's boundaries, it is multiplied by the PZ-, PZ+ coefficients:
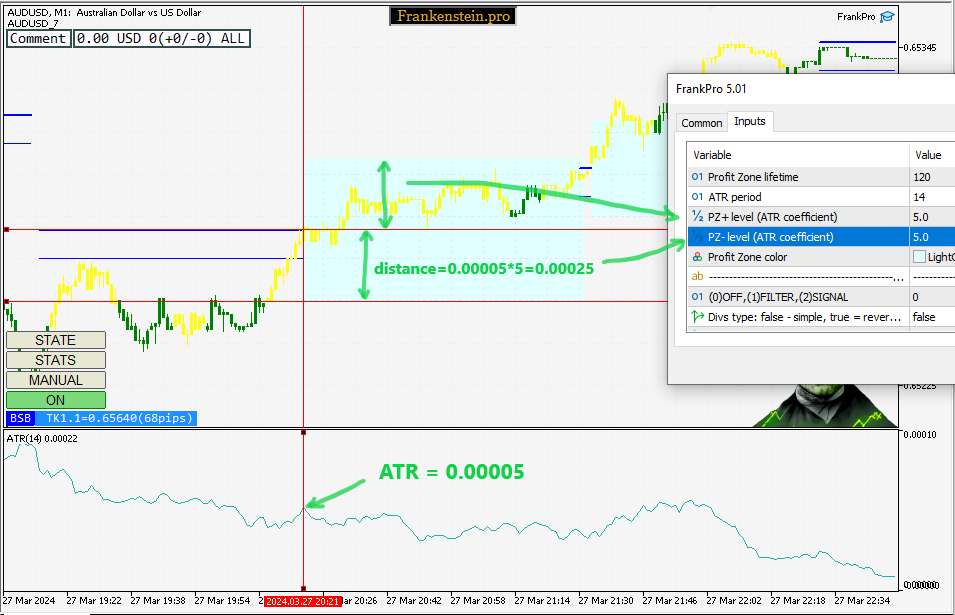
PZ- level sets the minimal price.
PZ+ level sets the maximal price.
If any candle closes outside this range - the pattern is filtered out.
iSTB
BSB, MSB pattern models include signals from a custom "StarBar" indicator (iSTB).
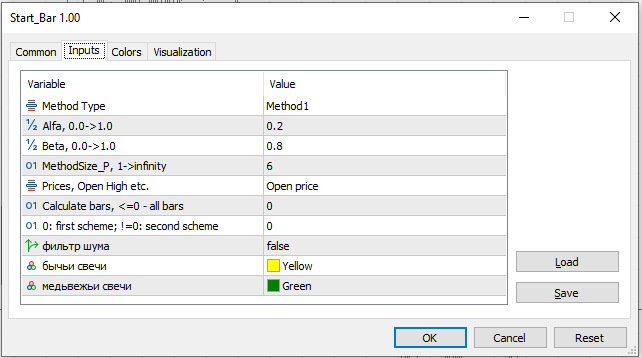
StartBar is based on iTrendDetector, it has the same inputs:
BSB, MSB trigger
BSB and MSB pattern scheme:
1) Key Level Puncture
2) Profit Zone Formation
3) Start Bar Rotation
Start Bar Rotation is StartBar switching and signaling opposite direction.
The rotation must happen within the current Profit Zone(previously defined with ZV-, ZV+ parameters).
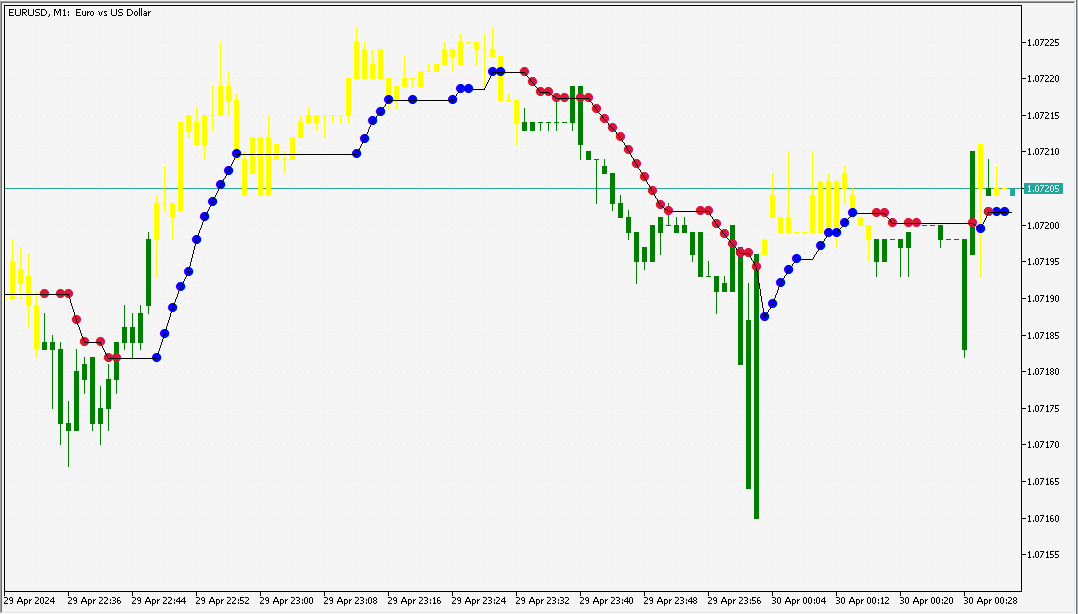
A trading signal is created the moment the Start Bar rotation ends, as indicated
with iSTB(StartBar indicator, see the candles colored yellow or green):
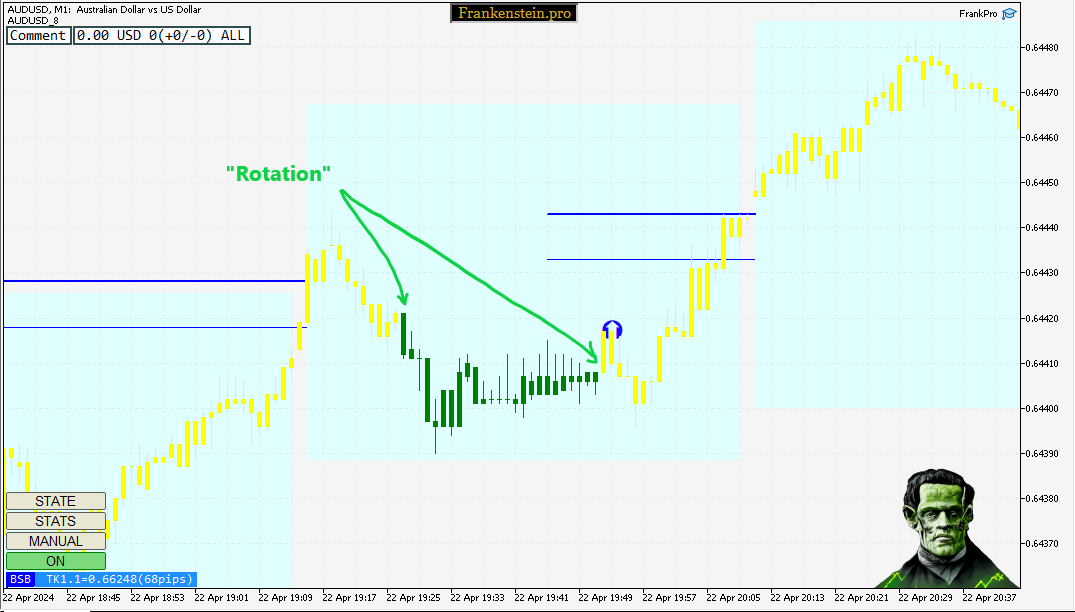
The green region end is marked with the first yellow bar. The second yellow bar
has a trading signal drawn over it; the full pattern has been formed(Key Level Punctured and Start Bar has "rotated").
Thus, trading has been triggered.
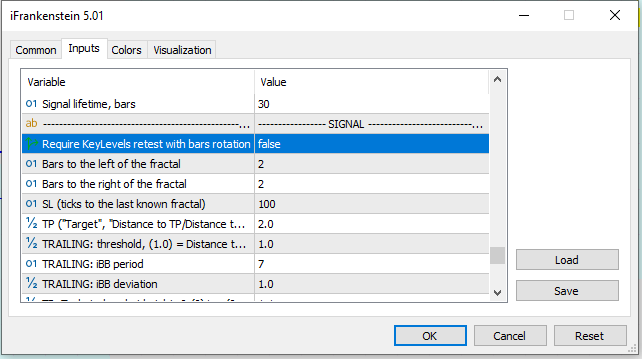
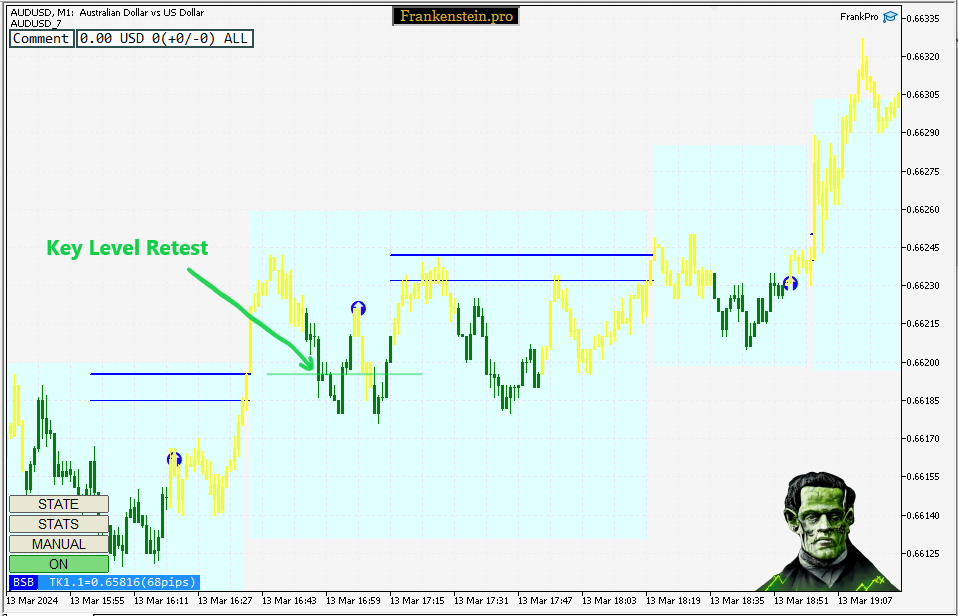
BSB, MSB KeyLevel Retest
If the parameter 'Require KeyLevels retest with bars rotation' is set to true,
the rotation must re-puncture the KeyLevel again with High or Low price of one of the bars:
An example with a successful KeyLevel Retest, see the green bars(as indicated with StartBar1.02)
puncturing the previous KeyLevel again, in the opposite direction:
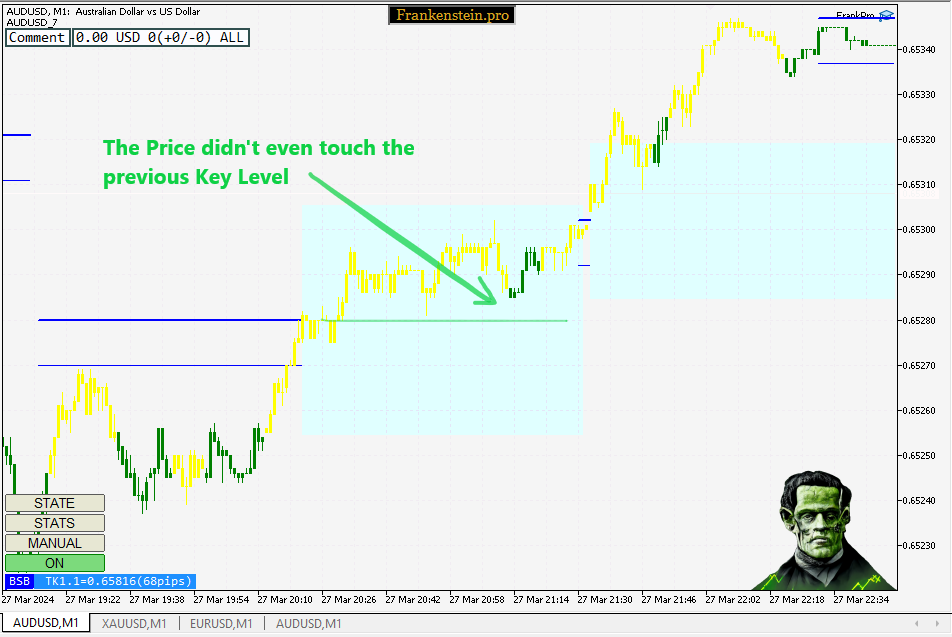
In this case there was no KeyLevel Retest, so the signal never formed:
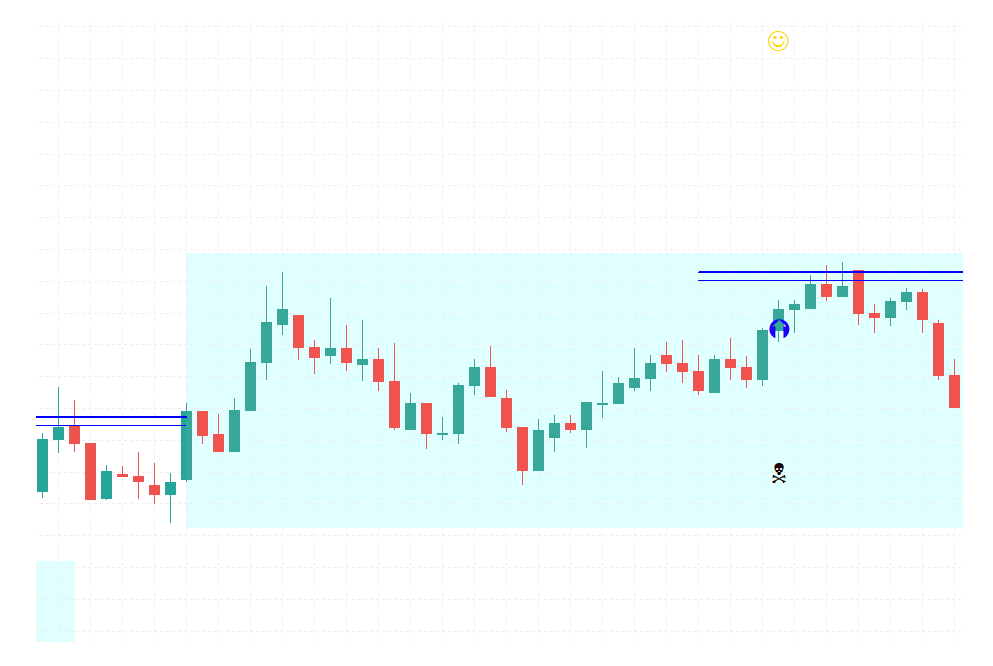
iSIG
Each Pattern, when completed, results in an Entry Point(entry points are managed by the iSIG module).
Each Entry Point is associated with a Stop Loss and a Take Profit,
if passed through filters.
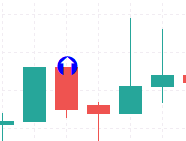
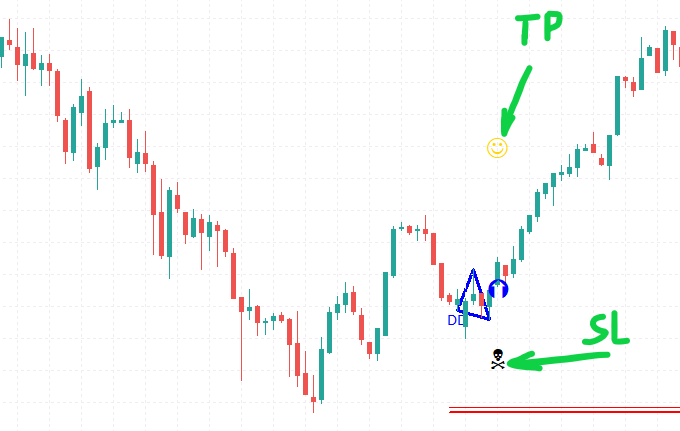
An Entry Point, on a chart, looks like a blue(buy) or red(sell) circle with an arrow inside of it:
If the trading environment and input parameters allow for opening a trade,
Take Profit and Stop Loss symbols appear:
Stop Loss
The distance to Stop Loss is specified in ticks.
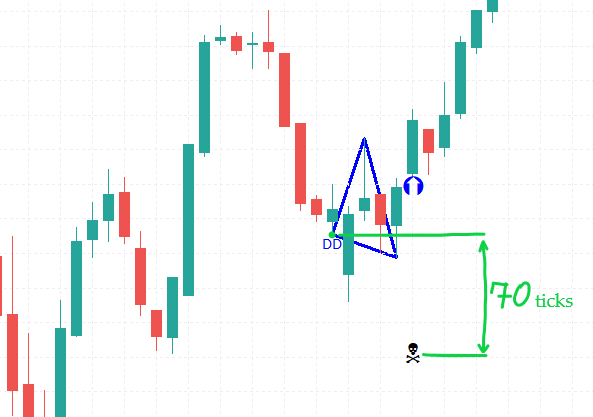
See 'SL(ticks to the pattern's base)' input parameter:
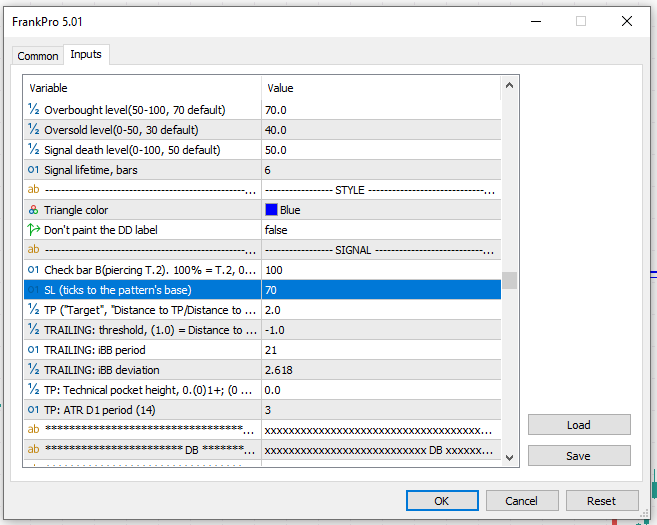
The pattern's base is the triangle's left corner.
In the next example, for DD(Double Bottom), the specified SL distance is 70 ticks ('tick' definition):
Take Profit
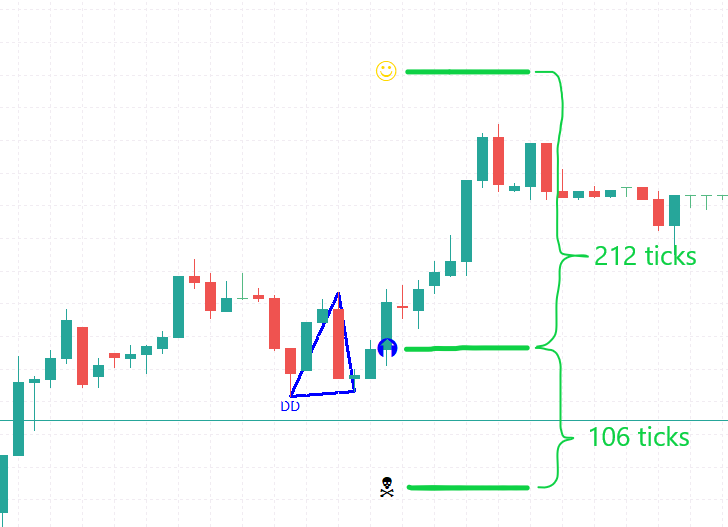
The distance to Take Profit is specified with a ratio value.
See 'TP("Target")' input parameter.
The value represents the ratio between the distance to SL and the distance to TP
(from the Entry Point price).
1.0 stands for equal SL and TP,
2.0 sets TP twice as 'big' as SL.
In the next example, for DD(Double Bottom), the TP is set to 2.0,
so the distance to TP(212 ticks) is twice as big as
the distance to SL(106 ticks):
Divergences
iFrankenstein hosts iRSI_iDiv - a divergences module.
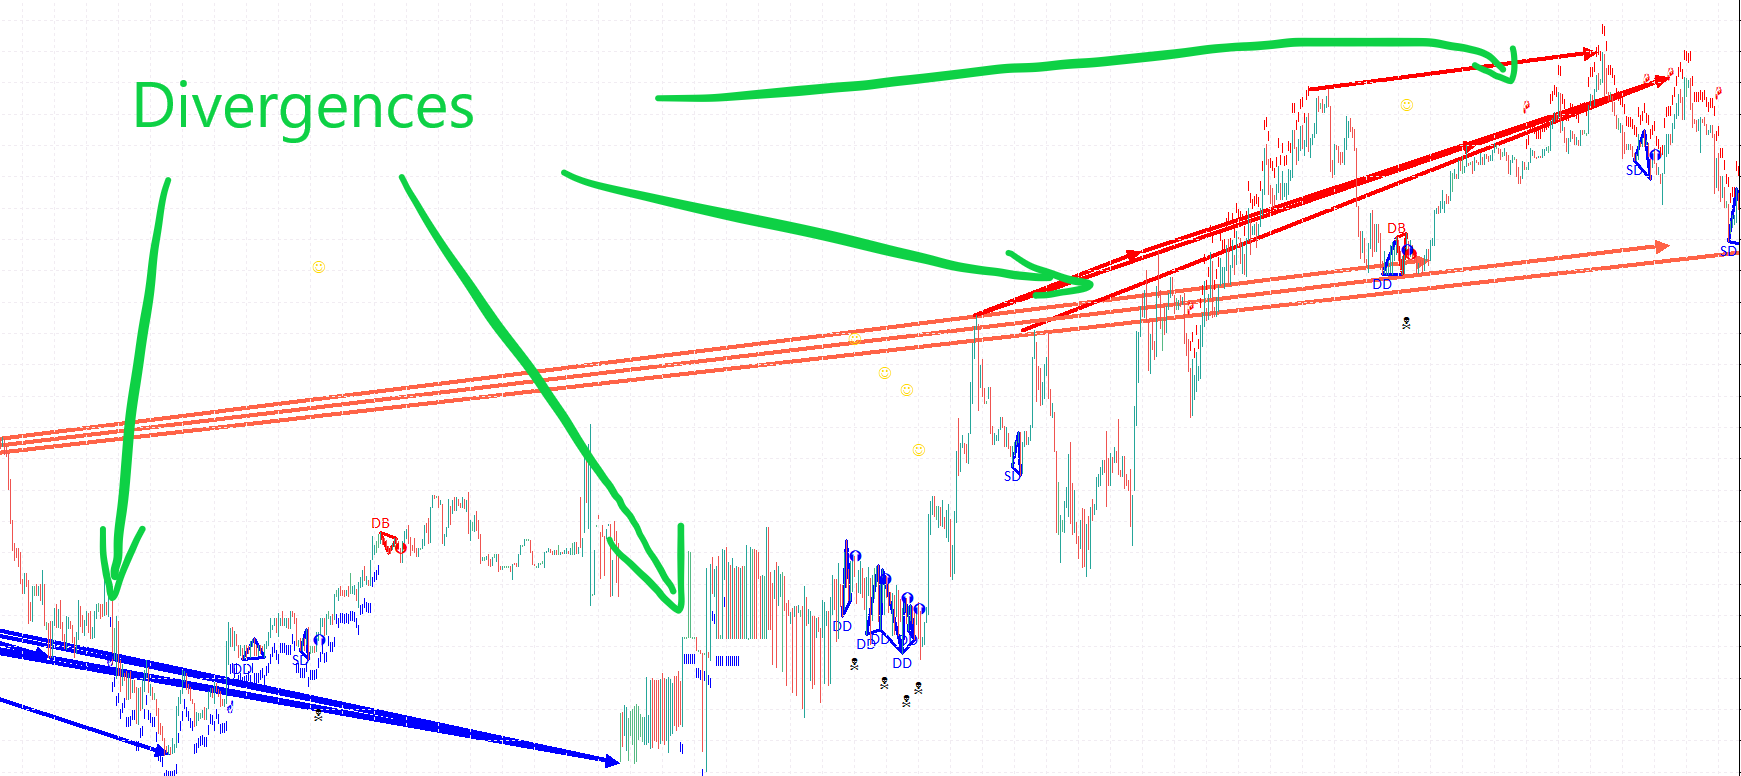
For divergences detection a separate timeframe is used, it is specified with 'TF for the RSI divergences' parameter.
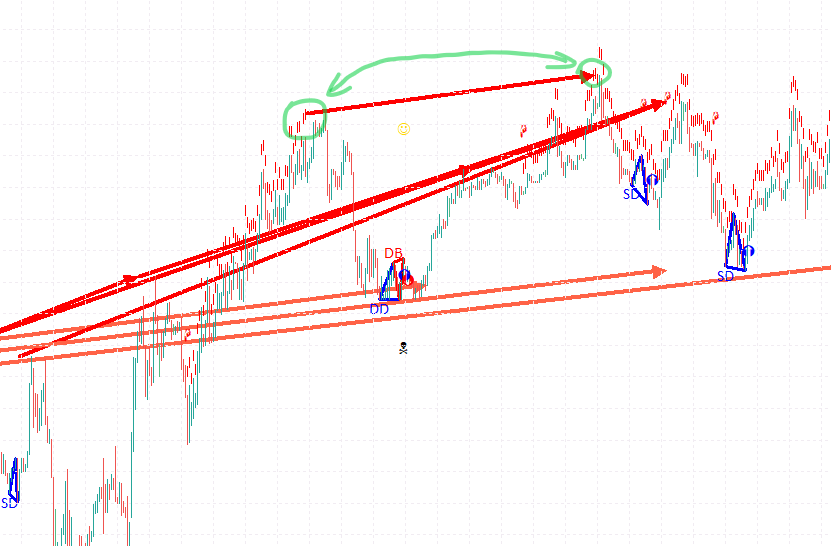
Arrows on the chart symbolize price peaks that define the divergence:
In trading, "divergence" is a situation where the price movement of an asset
differs from the movement of an indicator that typically follows the price,
such as a momentum oscillator or a trend indicator(RSI for ex.).
This can indicate a potential reversal or weakening of the current price trend.
Series of vertical lines above bars symbolize an activated divergence signal:
For each of the 10 patterns there's a separate block of parameters
for divergences:
Divergences module acts as a filter.
It either allows the trade or forbids it.
There's 3 main categories of divergences, based on their structure and ways of application:
Bearish and Bullish divergences mirror each other, here's
an example a Simple Bearish divergence:
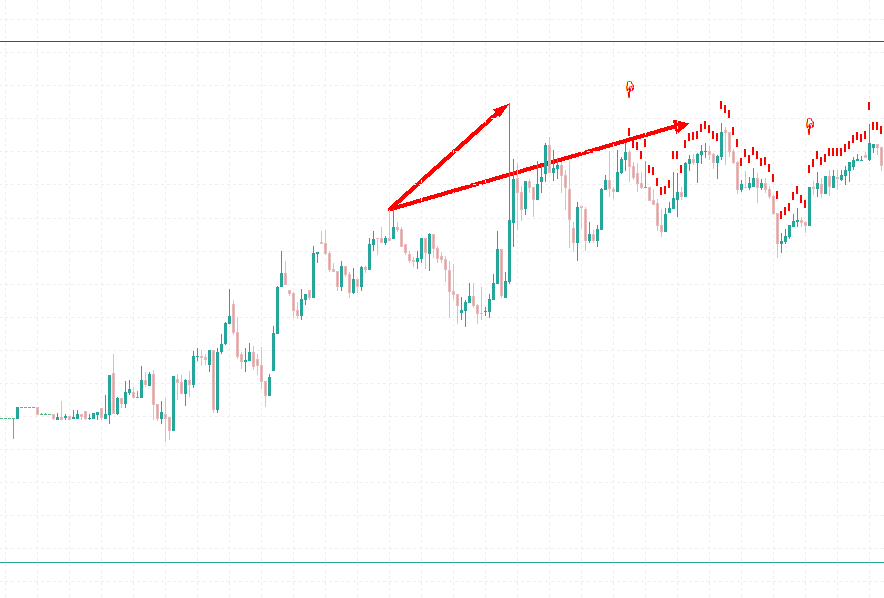
Simple Bearish divergences are generally used as SELL signals.
Bullish divergence is a mirror copy of the Bearish divergence, but signals BUY and
is drawn in blue color:
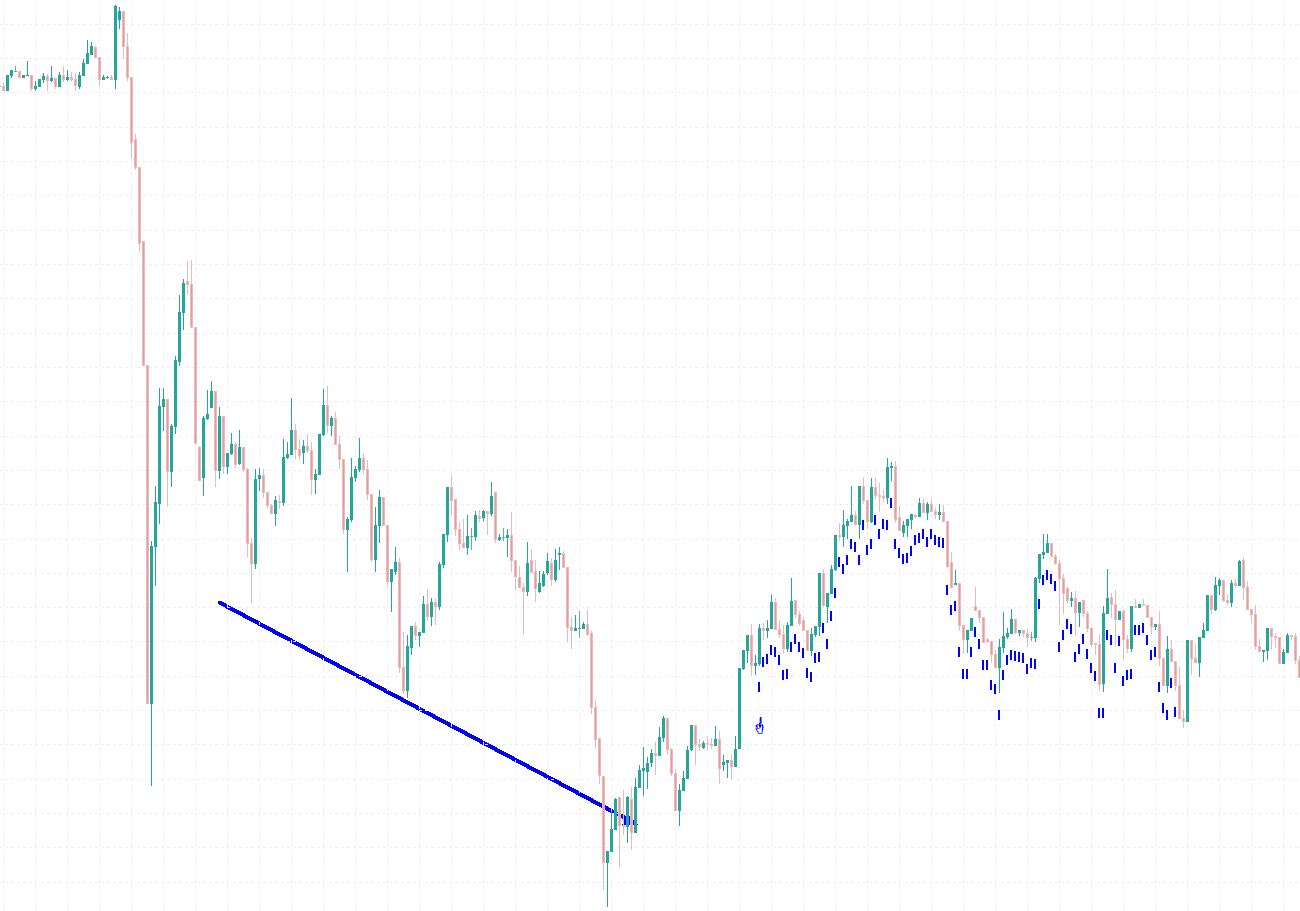
Reverse Bearish Divergence, often referred to simply as "bearish divergence",
occurs in technical analysis when the price of an asset makes lower Highs
while an oscillator (such as the Relative Strength Index (RSI), Stochastic, or MACD)
makes higher Highs. This situation suggests that despite the asset's price trend,
the momentum or underlying strength is increasing, indicating that the selling pressure
may be easing and a potential reversal to the upside could occur(acts as a bullish signal).
Reverse Bearish Divergence:
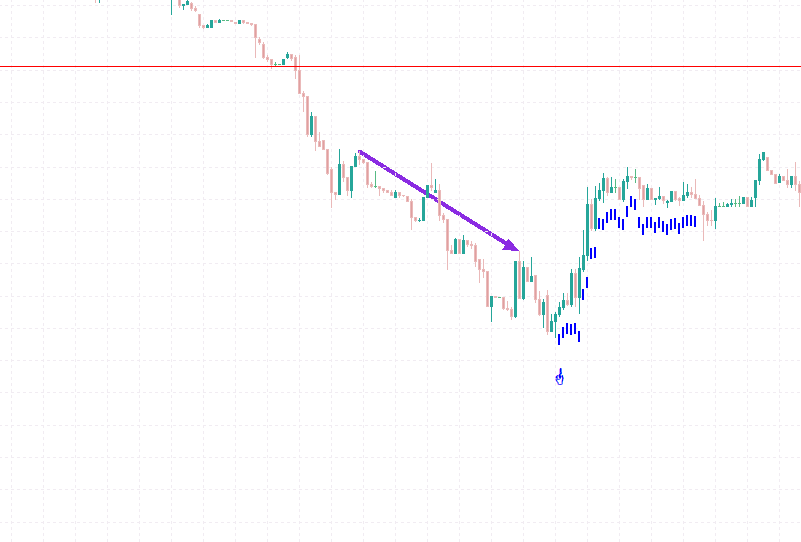
Same goes for the Reverse Bullish divergence, it is defined as different in price dips:
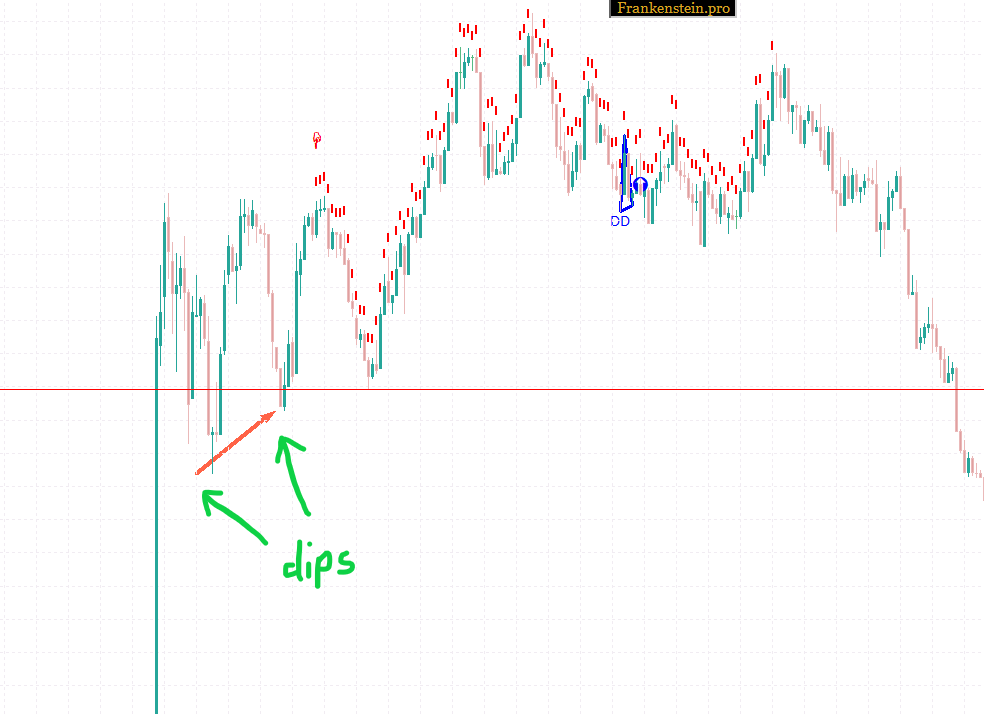
All types of divergences can either be used to form a signal
or to set up a filter.
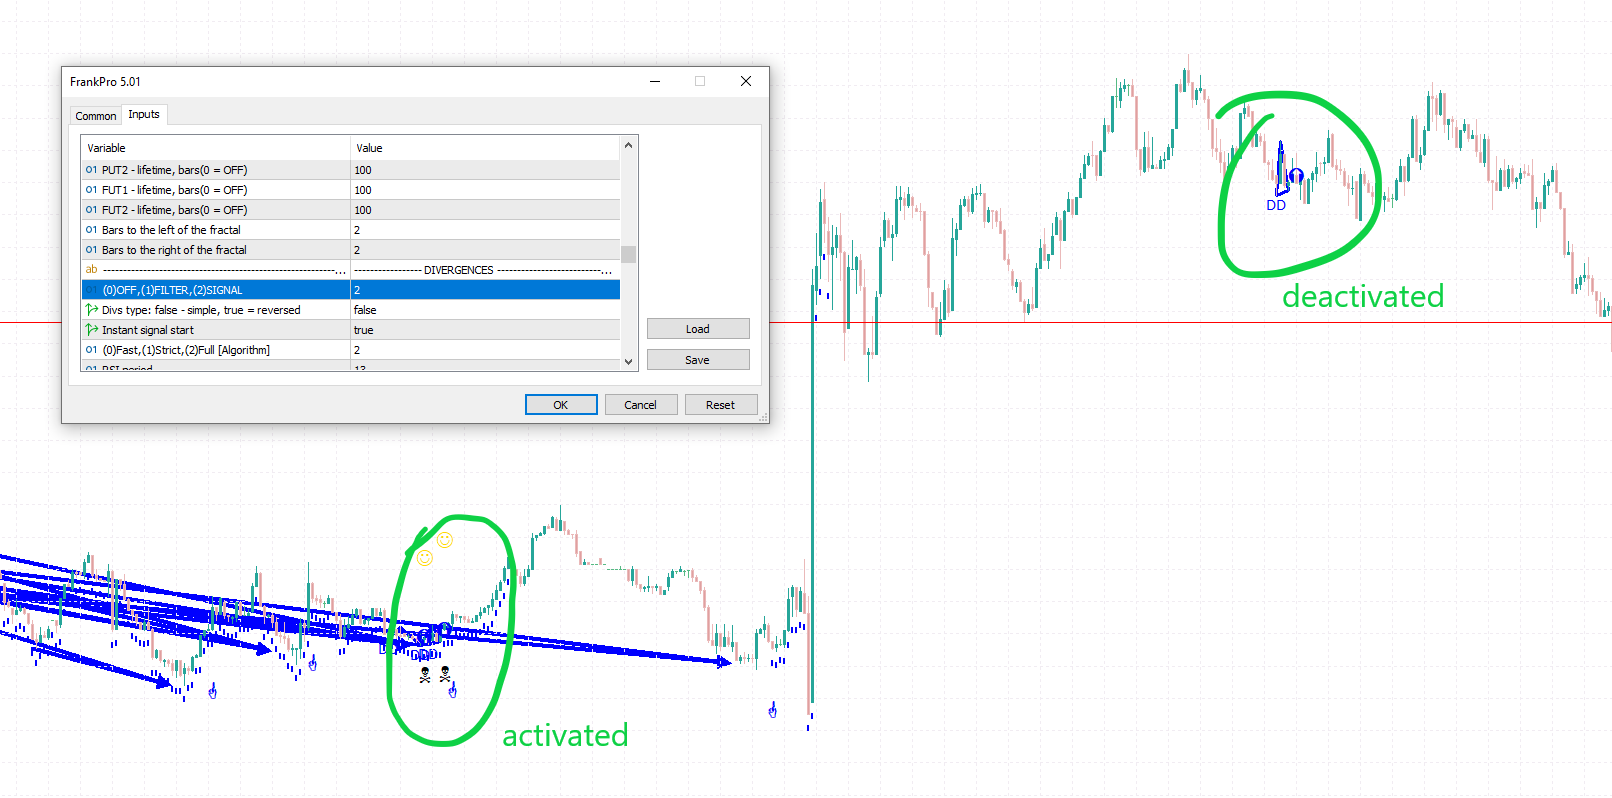
If module is set to 'Filter' - trades that oppose the signal are forbidden, filtered out(Entry Point is deactivated
and TP-SL symbols disappear).
For example, whenever a bearish divergence is detected and, simultaneously, a SELL signal from the divergences module is alive -
Entry Points get deactivated(SL and TP disappear):
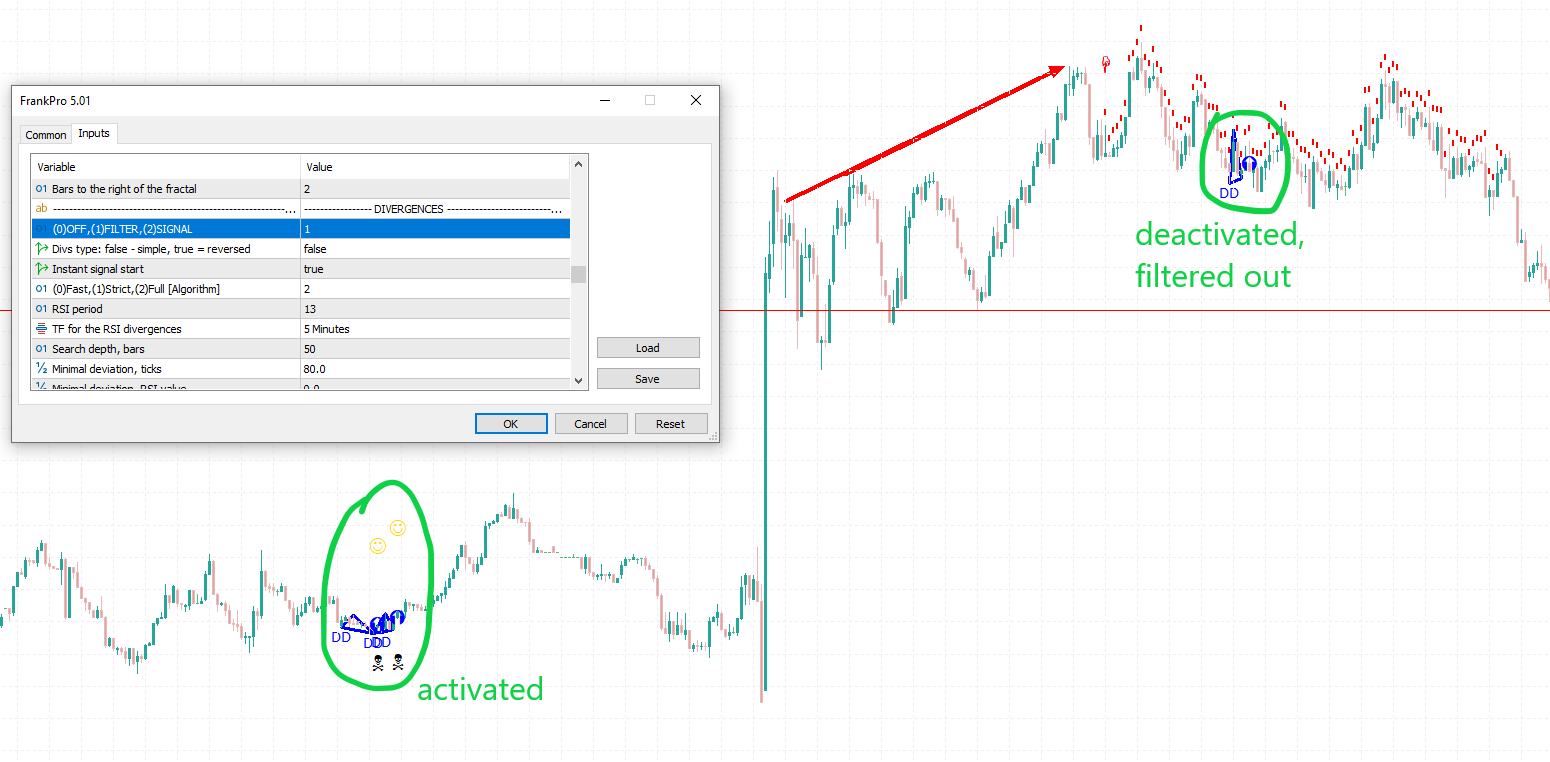
If module is set to 'Signal' - only trades that match an active divergence signal are allowed.
In the next example only those Entry Points are activated that
are located within the divergences module's alive signal(the activated have TP and SL visible):
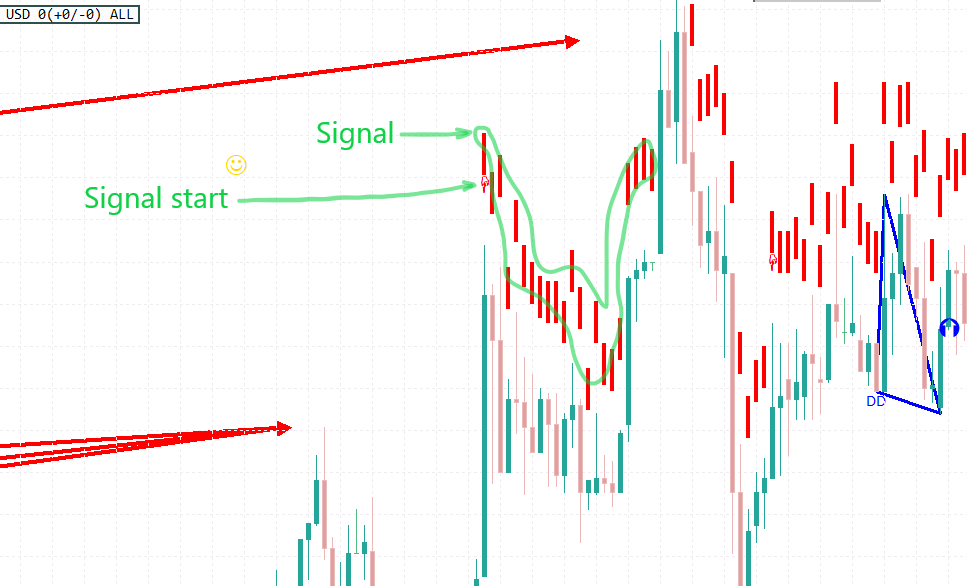
For more detailed understanding let's look at iRSI_Div.ex5 - an indicator executable featuring Divergences:
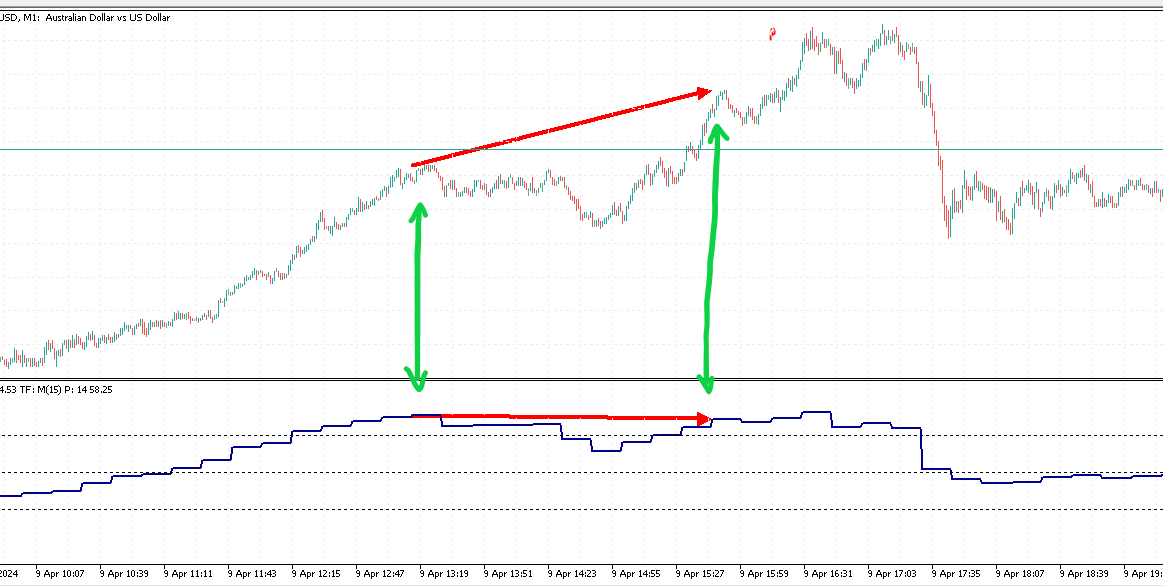
You can see a simple bearish divergence was formed by the difference between
directions of the vectors on RSI and vectors on price charts.
The price has made a new high, a new price peak, but the RSI graph showed
lower peak.
In the example above, 'Instant Signal Start' parameter is set to false
and the signal did not start because for the signal to start the RSI value first has to
exceed the level specified by Overbought/Oversold parameters.
In the next example the signal did start:
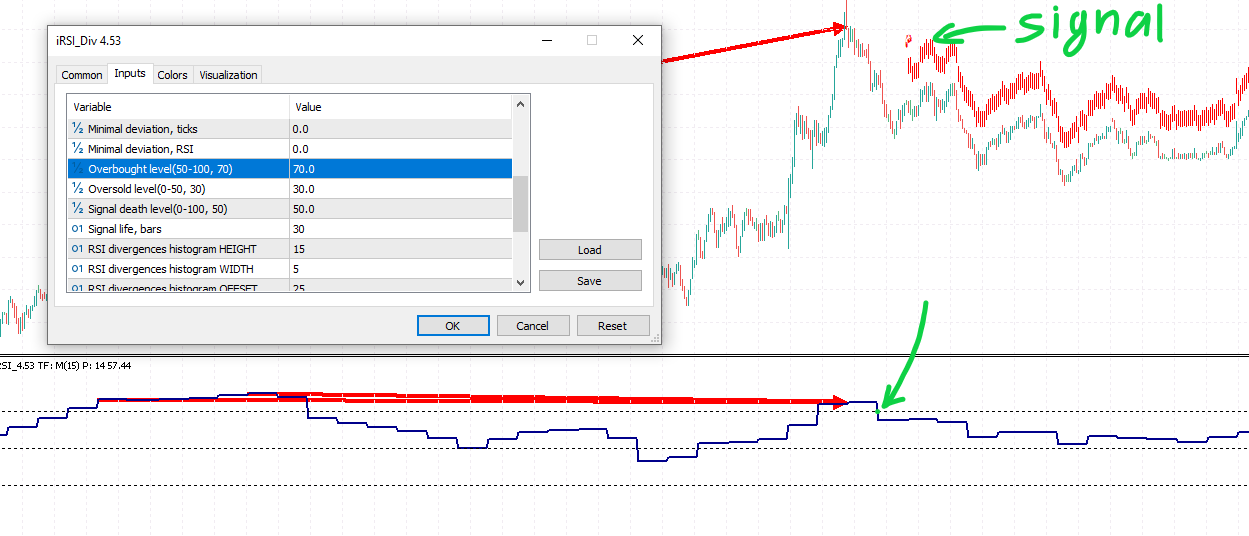
If the 'Instant Signal Start' parameter is set to true
the signal starts instantly no matter the environment.
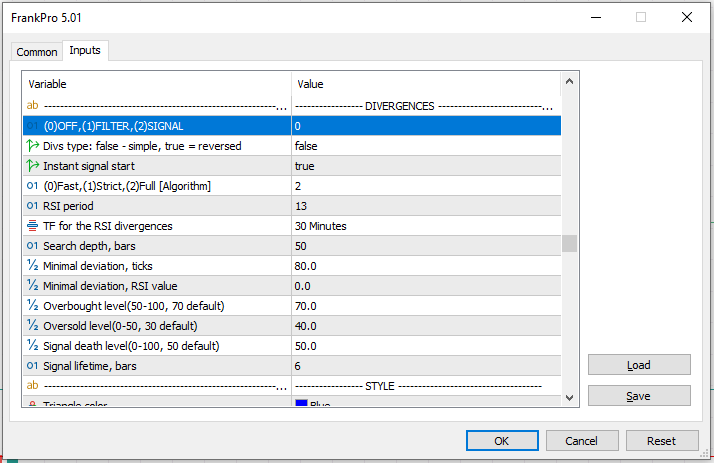
Other important parameters to consider for optimization:
- 'OFF,FILTER,SIGNAL' — 0 = OFF the Divergences module, 1 = set as FILTER, 2 = set as SIGNAL provider.
- '(0)Fast,(1)Strict,(2)Full' — Divergences Detection Algorithm. "Fast" is fast but is easily triggered. Strict is slower, but gives better precision, less noise. Full is the slowest but the most powerful one, creates a lot of noise.
- 'RSI period' — period for the RSI module. Values in the range of 4-20 are reasonable.
- 'Search depth, bars' — the search depth, in bars of the specified TimeFrame. The algorithm does not parse further this value.
- 'Minimal Deviation, ticks' — the minimal difference between the price values of the peaks to trigger divergence detection. The so-called 'Sensitivity' factor.
- 'Minimal Deviation, RSI value' — the minimal difference between the values of the RSI peaks to trigger divergence detection.
- 'Signal Death level' — the RSI value at which the signal dies.
- 'Signal Lifetime, bars' — the lifetime of the signal, in bars.
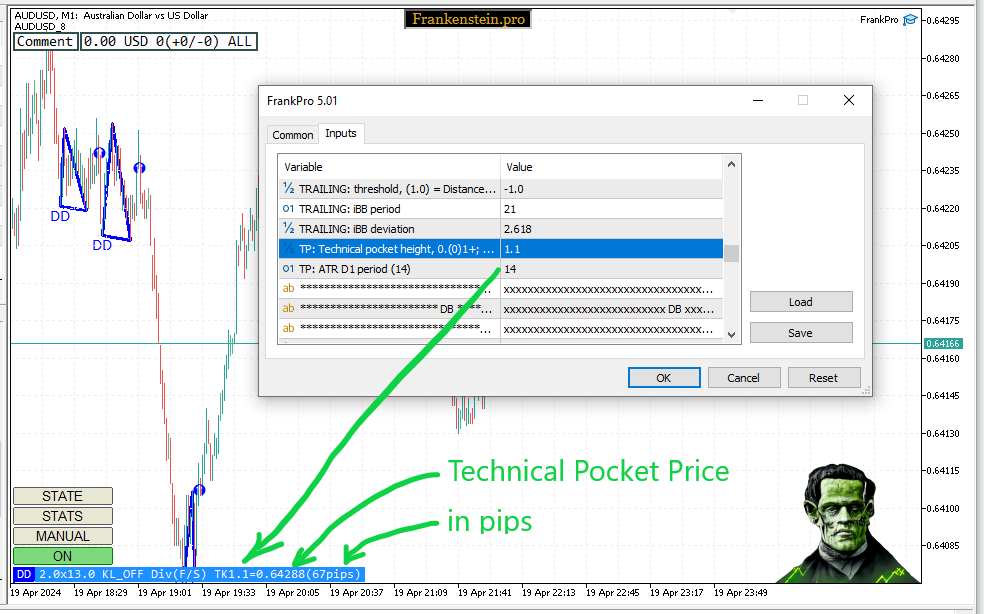
Technical Pocket
TP - Technical Pocket - is a volatility-filter.
It defines the minimal required volatility on D1 for a trade to be approved.
The higher the value - the higher volatility is required.
On chart with Frankenstein EA, TechnicalPocket status is displayed at the bottom:
Day volatility is measured with Average True Range (ATR) indicator.
The Technical Pocket value is defined as
ATR value for the previous day(D1 timeframe) multiplied by
the factor "TP:Technical Pocket Height":
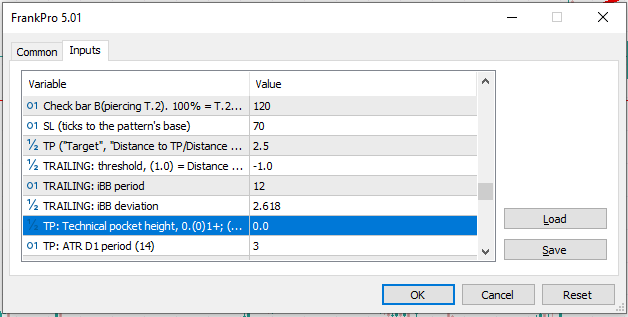
Each of 10 patterns(DD, DB, SD...) has its own block of input parameters for T.Pocket.
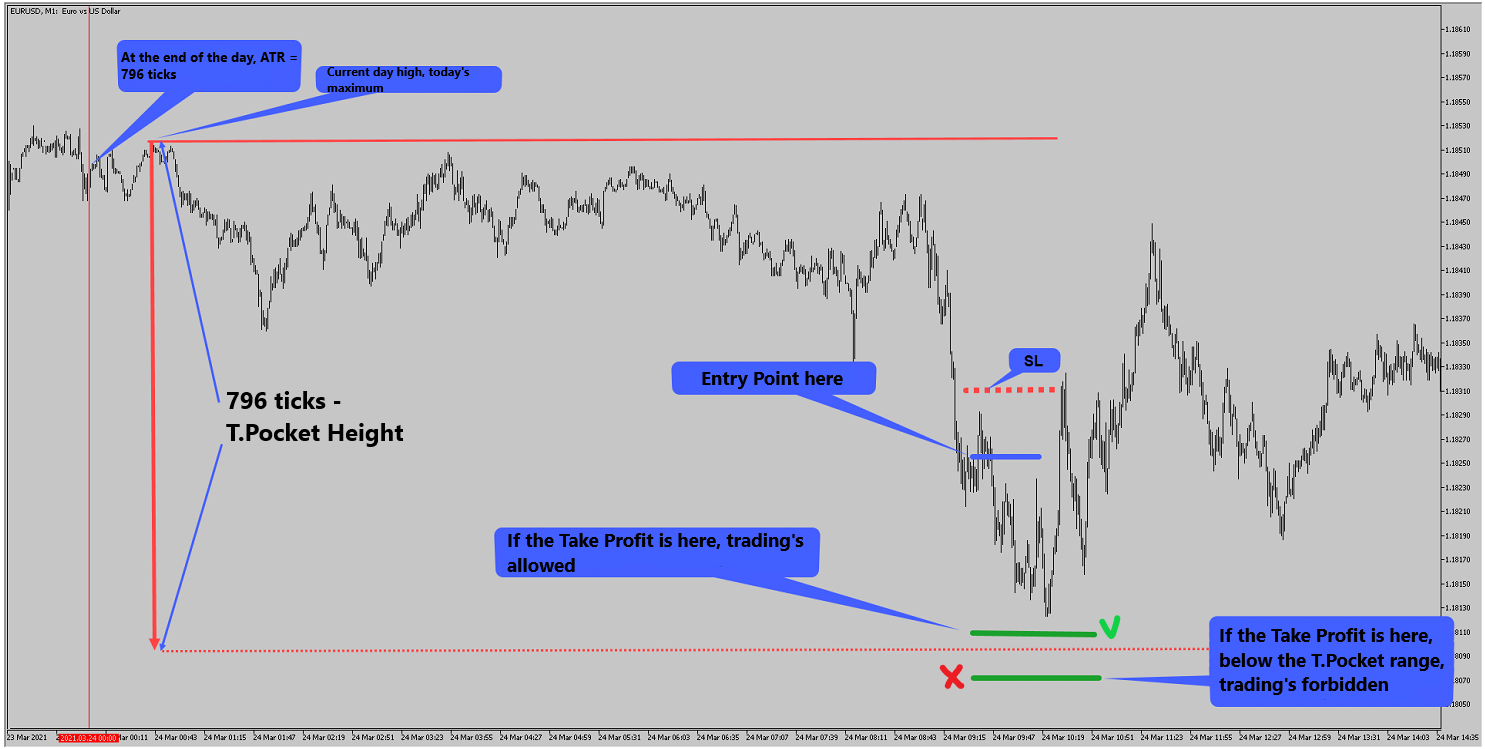
If Take Profit is placed outside the price limits allowed by Technical Pocket —
trading is canceled(filtered out).
The price limit for Take Profit is arithmetically defined as the High(or low for SELL) of the current day
minus the Technical Pocket value.
The idea of this filter is to trade only positions supported by high volatility of the previous days(weeks).
Or, in other words, it only allows trading if previous days(weeks) were volatile enough,
and the trading volume hasn't exceeded some derived value.
Example...
ATR on Daily gives us the Technical Pocket value:
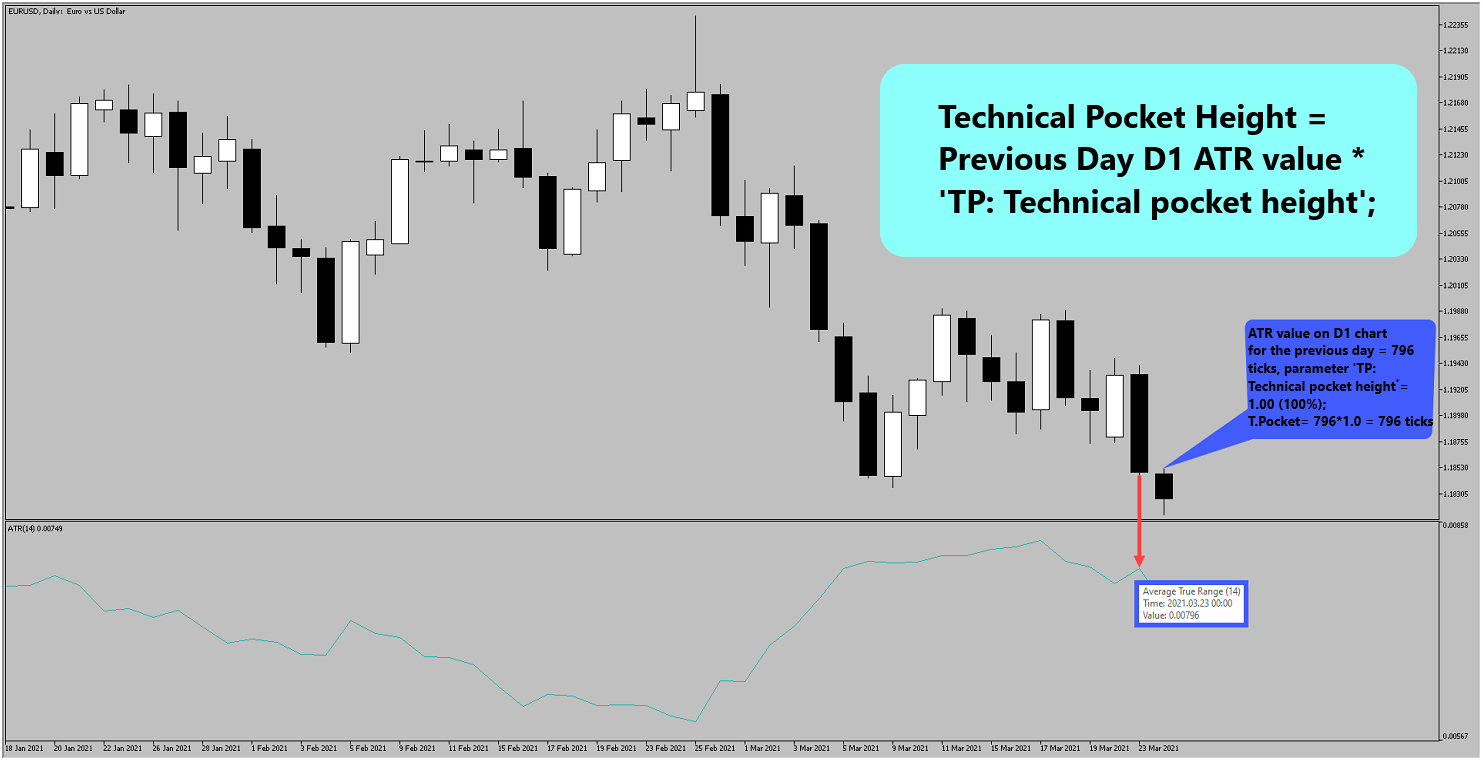
ATR value for the previous day is 796 ticks.
"TP:Technical Pocket Height" = 1.0. (1.0 is 100%. For 150% use 1.5, and so on...)
This makes the Technical Pocket value = 796 ticks * 1.0 = 796 ticks.
Subtract this value from the current day price maximum; the resulting value sets the threshold
for the Take Profit:
Retrospection Depth
An important parameter to mention - Retrospection Depth:
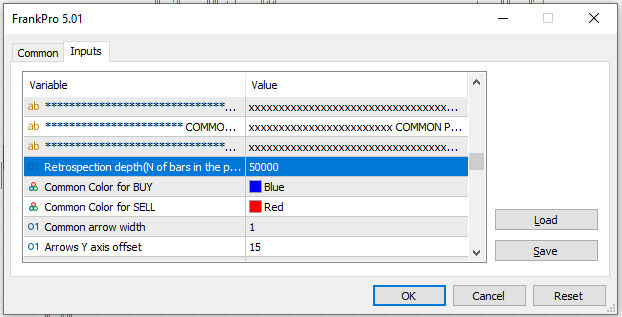
Configures the depth of calculation on historical data for the indicator engine.
It sets the range of bars that indicator data is being process prior to the last
known historical data bar. It's a precalculation range.
The higher the value the deeper you can see into the past.
To spare the RAM, CPU resources, the value is supposed to be in the 100'000nds.
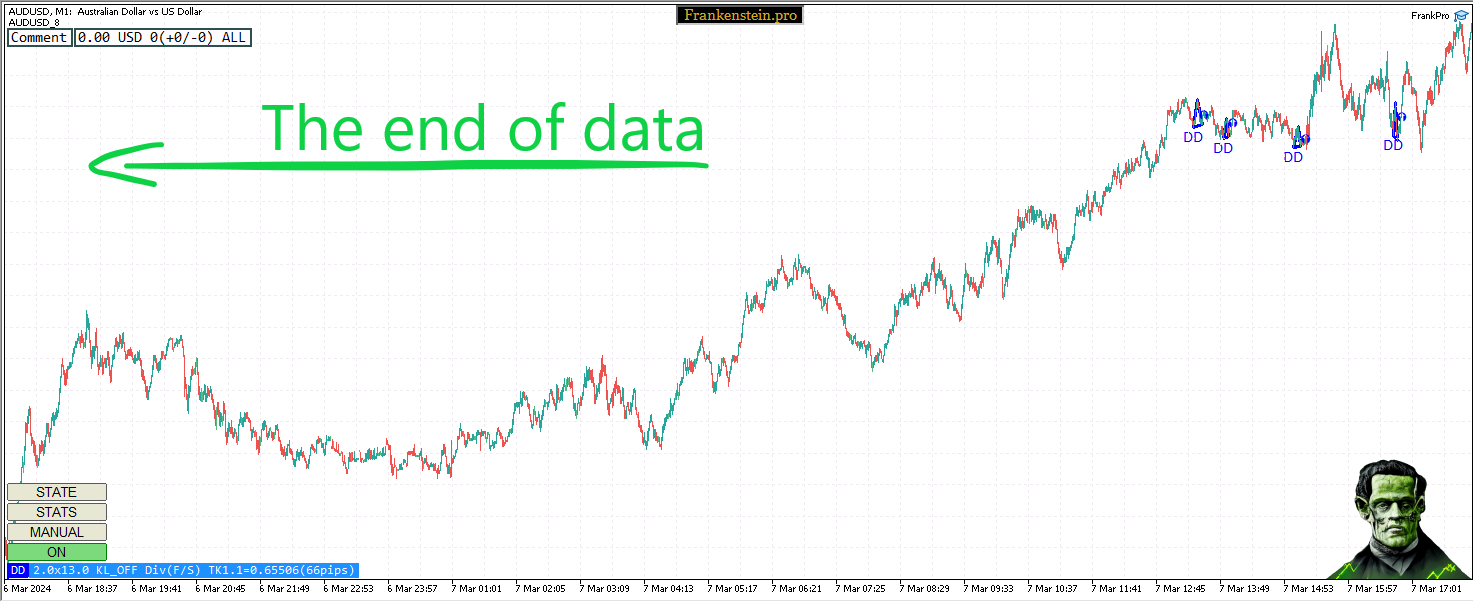
In the following example there's no more data calculated and available to the left of the visible range(reached
the end of retrospection):
Additional Filters
Additional trading-level RSI MACD filters can be applied:

Possible Filter Types:
- ENUM_INDICATOR_RSI_TYPE1 - FORBID ABOVE VALUE
- ENUM_INDICATOR_RSI_TYPE2 - FORBID BELOW VALUE
- ENUM_INDICATOR_RSI_TYPE3 - ONLY IF MOMENTUM IS DOWN
- ENUM_INDICATOR_RSI_TYPE4 - ONLY IF MOMENTUM IS UP
- ENUM_INDICATOR_MACD_TYPE1 - FORBID ABOVE VALUE
- ENUM_INDICATOR_MACD_TYPE2 - FORBID BELOW VALUE
- ENUM_INDICATOR_MACD_TYPE3 - ONLY IF MOMENTUM IS DOWN (of the main line)
- ENUM_INDICATOR_MACD_TYPE4 - ONLY IF MOMENTUM IS UP (of the main line)
- ENUM_INDICATOR_MACD_TYPE5 - CROSSED FROM UP DOWN (signal crossed the main line and is below)
- ENUM_INDICATOR_MACD_TYPE6 - CROSSED FROM DOWN UP (signal crossed the main line and is below)