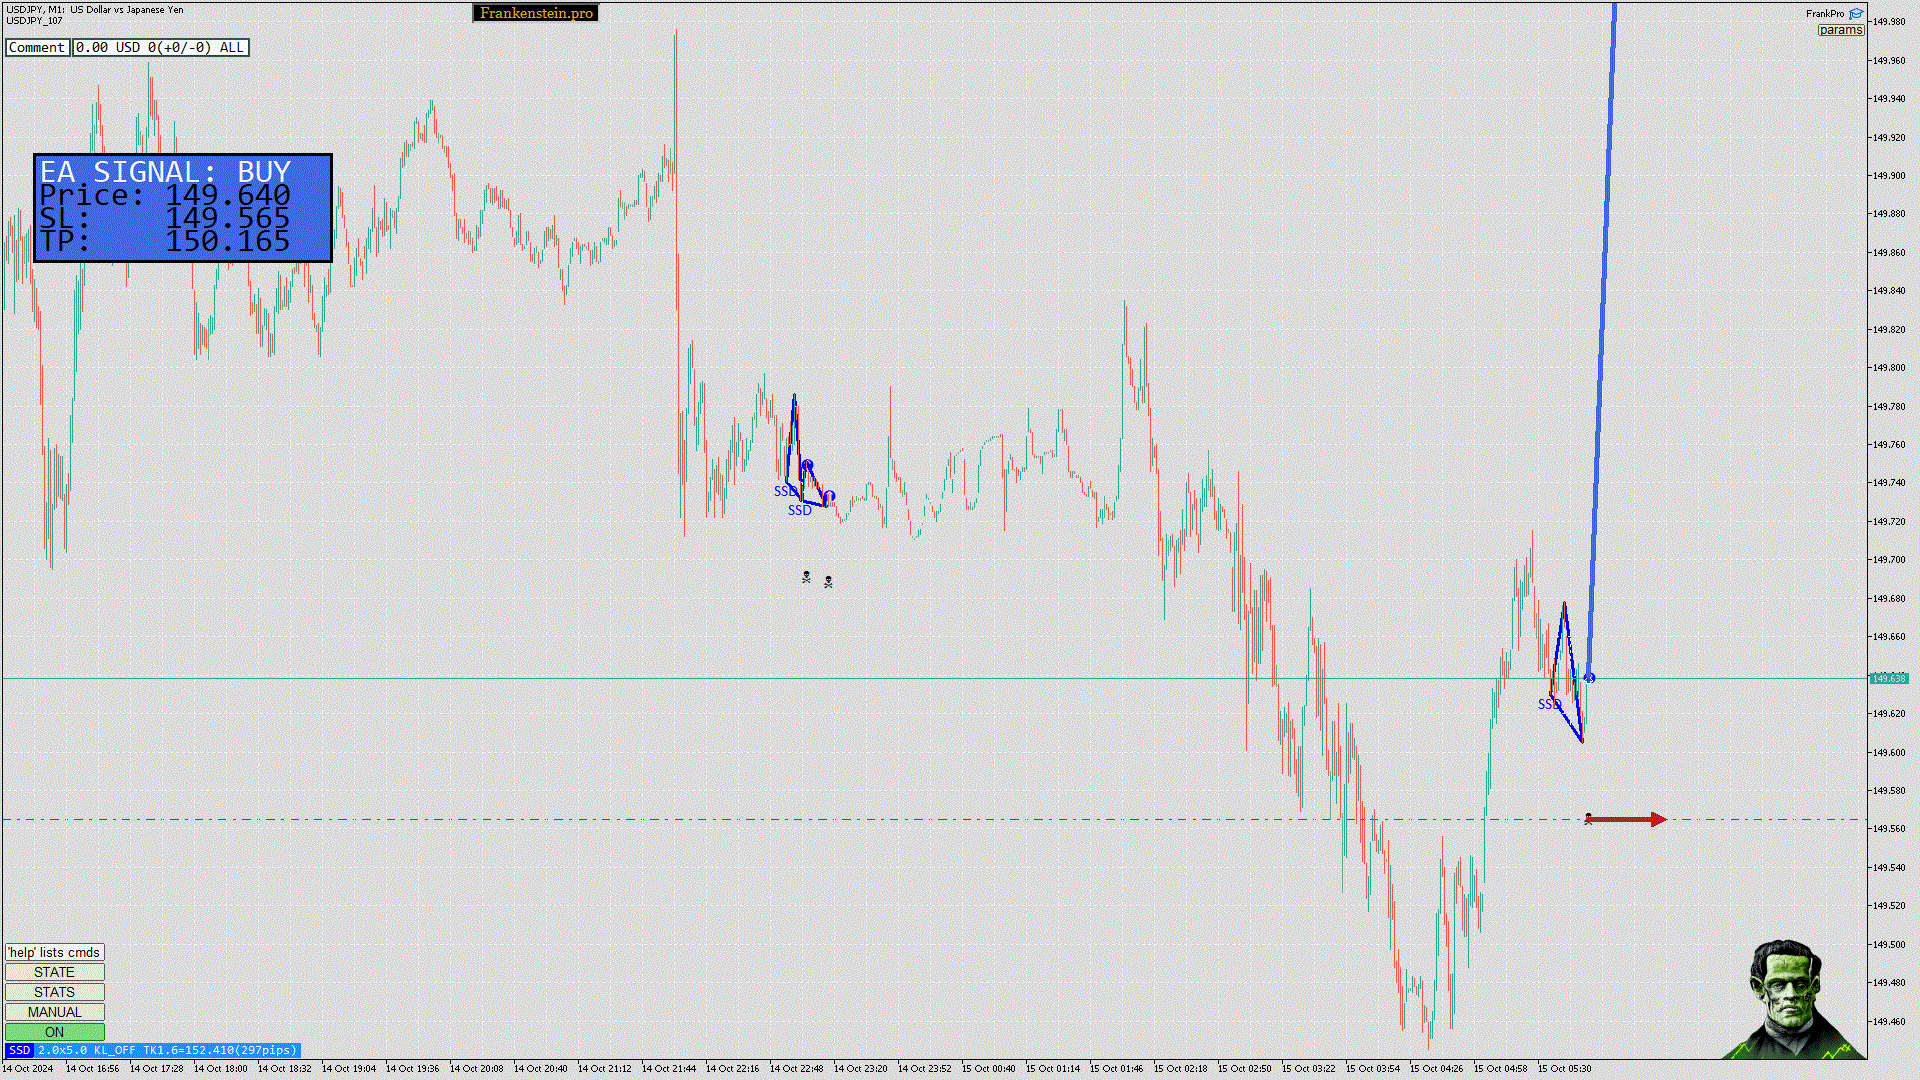
FrankPro Signal for USDJPY
Type: Screen
Signal: BUY
TP: 150.165
SL: 149.565
Entry Price: 149.64

Flexity Analysis for USDJPY
Forecast Overall(Short-Term, Long-Term): ST=Undecided LT=Strong Up
Forecast Methods(Short-Term, Long-Term):
[Method0] ST=Same LT=Up
[Method1] ST=Down LT=Up
[Method2] ST=Up LT=Up
FlexityIndicator Analysis Method(0)
Here is the structured data formatted in HTML:
USD/JPY Price Movement Assessment
Short-term (October 14-18, 2024)
| Key Points | Expected Price Movement |
|---|---|
| Support level near 145.85 | Possible rebound and growth to above 156.85 if breakout occurs |
| Current price holding steady above 149.00 | Influenced by fresh supply and cautious trading due to geopolitical risks |
| Struggling to break above 150 yen level | Potential volatility ahead |
Expected short-term price movement: Stay the same with a possible slight increase to test the resistance area near 151.85.
Long-term
- Moving averages indicate a bearish trend
- Breakout above resistance area could confirm growth option
- US Dollar's sensitivity to recent data releases driving volatility
- Fed's data-dependent policy and overall economic outlook influencing pair's movement
Expected long-term price movement: Go up. Potential growth option supported by possible breakout above resistance area and US Dollar's strength. However, bearish trend and uncertainty surrounding BoJ's monetary policy stance may cap the upside.
Result: [Method0] ST=Same LT=Up
FlexityIndicator Analysis Method(1)
Here is the data structured and formatted in HTML for better readability:
USD/JPY Price Movement Assessment
Short-term (next few days/week)
| Expected Price Movement | DOWN (with potential rebound) |
|---|---|
| Key Levels |
|
| Potential Scenarios |
|
Long-term (next few weeks/months)
| Expected Price Movement | UP (with potential for significant growth) |
|---|---|
| Key Levels |
|
| Market Influencers |
|
Please note that these assessments are based on the provided analysis and are subject to change as new market data and events become available.
Result: [Method1] ST=Down LT=Up
FlexityIndicator Analysis Method(2)
Here is the data structured and formatted in HTML for better readability: **USD/JPY Price Movement Assessment** **Short-term Outlook (Next Few Days to a Week)**
| Expectation | Target Levels | Risk Factors |
|---|---|---|
| Bullish | Break above 147.21, testing 149.40 (7-week high) | Pullback to 144.97 (9-day EMA) or 143.60 (lower boundary of ascending channel) due to geopolitical tensions and BoJ's monetary policy uncertainty |
| Expectation | Target Levels | Influencing Factors |
|---|---|---|
| Bullish | Rebound from upper border of descending channel, growing to area above 156.85 | BoJ's monetary policy stance, geopolitical tensions, US Federal Reserve's interest rate decisions |
- Short-term: Up (with potential pullbacks to support levels)
- Long-term: Up (with potential for further upside momentum)
Result: [Method2] ST=Up LT=Up

